In this article I’ll walk you through the terms Descriptive statistics and Inferential statistics .
This is the 3rd of the series on understanding statistics(theoretical) , as I prefer people to understand the basic concepts which are the building blocks.
If you wish to check the previous article below is the link .
Basics of Statistics — Part 2
This is the 2nd part of the series of Understanding Statistics.
In the world of statistics and the ever growing Data science field Data is available, but that alone doesn’t help in order to achieve the end results that’s where Information comes in handy.
Doesn’t add up to anything right ?Let me put it this way, it’s your first day at a sales team and your boss asked you to make a presentation and handed you a Excel sheet.You know nothing about the data which was shared with you.That’s where Descriptive Statistics saves your day :)
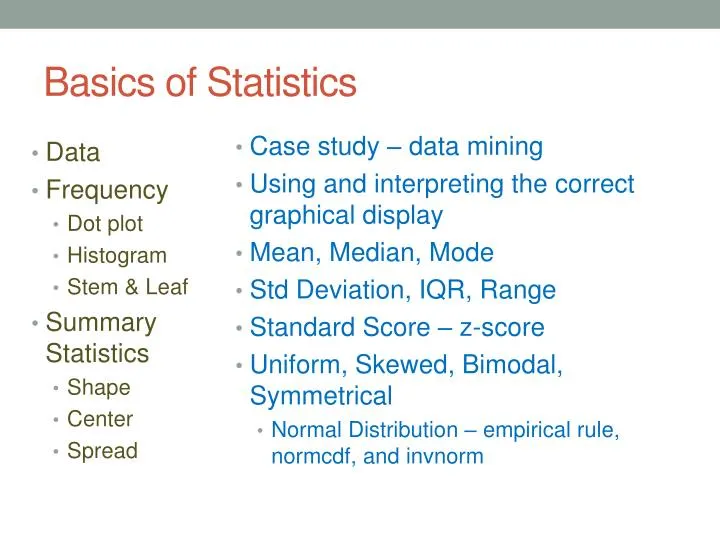
The Transition of Data in to Information is Descriptive Statistics is all about.
How do you Describe a Data?
In Statistical terms Data is described by
- Frequency Distribution
- Central Tendency
- Dispersion/Variation
Frequency Distribution : A frequency distribution is an overview of all distinct values in a variable and how often they occur. There are 3 types of frequency distributions based on the type and range of values
- Categorical
- Grouped
- Ungrouped
#statistics #basic-statistics #analysis #data #big data