This two-part post will explore a set of popular open-source observability tools, easily integrated with the Istio service mesh. These tools include Jaeger for distributed transaction monitoring, Kiali for application visualization, Prometheus for metrics collection and alerting, and Grafana for metrics querying, visualization, and alerting. We will round out the toolset with Fluent Bit for log processing and forwarding. Using these tools, we will observe a microservices-based reference application platform deployed to an Amazon Elastic Kubernetes Service (Amazon EKS) development cluster on AWS.
Observability
Similar to quantum computing, big data, artificial intelligence, machine learning, and 5G, observability is currently a hot buzzword in the IT industry. According to Wikipedia, observability is a measure of how well the internal states of a system can be inferred from its external outputs. The O’Reilly book, Distributed Systems Observability, by Cindy Sridharan, describes The Three Pillars of Observability in Chapter 4: “Logs, metrics, and traces are often known as the three pillars of observability. While plainly having access to logs, metrics, and traces doesn’t necessarily make systems more observable, these are powerful tools that, if understood well, can unlock the ability to build better systems.”
Logs, metrics, and traces are often known as the three pillars of observability.
Honeycomb is a developer of observability tools for production systems. The honeycomb.io site includes articles, blog posts, whitepapers, and podcasts on observability. According to Honeycomb, “Observability is achieved when a system is understandable — which is difficult with complex systems, where most problems are the convergence of many things failing at once.”
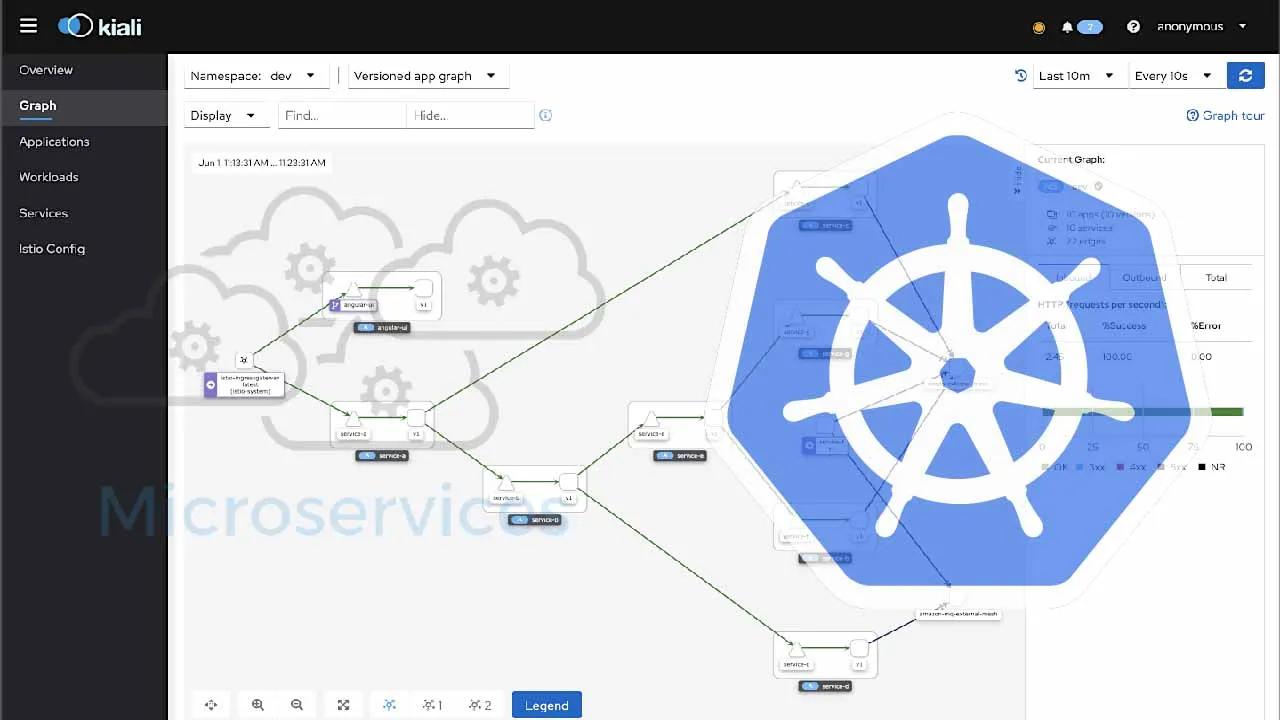
As modern distributed systems grow ever more complex, the ability to observe those systems demands equally modern tooling designed with this level of complexity in mind. Traditional logging and monitoring tools struggle with today’s polyglot, distributed, event-driven, ephemeral, containerized and serverless application environments. Tools like the Istio service mesh attempt to solve the observability challenge by offering easy integration with several popular open-source telemetry tools. Istio’s integrations include Jaeger for distributed tracing, Kiali for Istio service mesh-based microservice visualization, and Prometheus and Grafana for metric collection, monitoring, and alerting. Combined with cloud-native monitoring and logging tools such as Fluent Bit and Amazon CloudWatch Container Insights, we have a complete observability platform for modern distributed applications running on Amazon Elastic Kubernetes Service (Amazon EKS).
Traditional logging and monitoring tools struggle with today’s polyglot, distributed, event-driven, ephemeral, containerized and serverless application environments.
#kubernetes #istio #aws #microservices