Clustering is an unsupervised machine learning technique that divides the population or data points into several groups or clusters such that data points in the same groups are more similar to other data points in the same group and dissimilar to the data points in other groups.
- Points in the same cluster are closer to each other.
- Points in the different clusters are far apart.
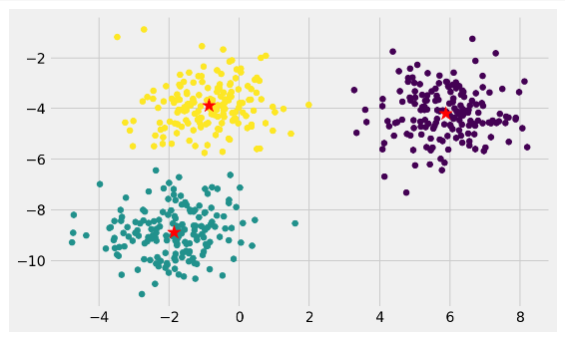
Source, Sample Datapoints, (Image 1)
In the above sample 2-dimension dataset, it is visible that the dataset forms 3 clusters that are far apart, and points in the same cluster are close to each other.
What is the Metric for Clustering?
Clustering is considered to be best if it has maximum intracluster distance and minimum intercluster distance.
Notes to avoid any confusion:

Intracluster distance: Distance between two point in different clusters
Intercluster distance: Distance between two points in the same cluster
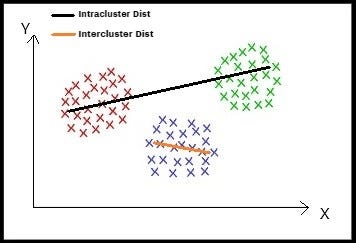
Intracluster and Intercluster Distance (Image 2)
The image above (Image 2), describes what is an intercluster and intracluster distance.
Various evaluation metrics are using which the effectiveness of formed clusters can be measured.
Dunn Index:
 <
<
The _numerator _of the above function measures the maximum distance between every two points (x_i, x_j) belonging to two different clusters. This represents the intracluster distance.
The _denominator _of the above function measures the maximum distance between every two points (y_i, y_j) belonging to the same cluster. This represents the intercluster distance.
Clustering having the max value of Dunn-Index is considered to be best.
Silhouette analysis:

This is used to determine the degree of separation between clusters. For each sample. a_i represents the average distance from all data points in the same cluster. b_i represents the average distance from all data points in the closest cluster.
The coefficient of SA can take values in the interval [-1, 1].
- SA = 0: the sample is very close to the neighboring clusters.
- SA = 1: the sample is far away from the neighboring clusters.
- SA = -1: the sample is assigned to the wrong clusters.
Therefore, we want the coefficients to be as big as possible and close to 1.
There are different types of Clustering technique, we will discuss one of them.
#machine-learning #towards-data-science #clustering #data-mining #data analysis