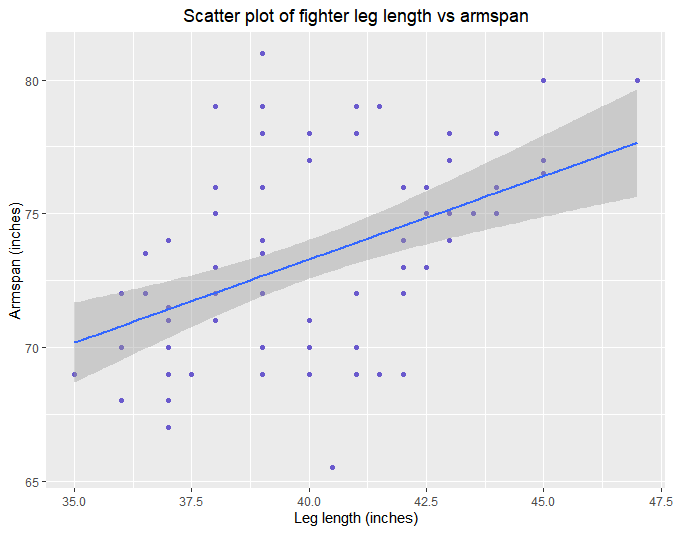
I recently published a paper on armspan and fighting success in mixed martial arts (MMA) fighters. I found that fighters with greater armspans have a very small advantage in fighting i.e. they win more. One issue I ran into was that I couldn’t rule out the hypothesis that leg length was driving the effect, because leg length data is not routinely collected for MMA fighters. We’d expect fighters with longer arms to have longer legs too, which would also presumably provide an advantage. I couldn’t find any data on correlations between arm and leg length in fighters, so I just left it at that.
I recently found an MMA league called The professional fighters league. It has armspan and leg length data from about 78 fighters. I thought it might be interesting to look at the correlation between arm and leg length in MMA fighters. It’s not a large sample, so doing anything fancier than a correlation is unlikely to be informative (my paper had ~1600 fighters!). We’d expect a large correlation between arm and leg length, so 78 fighters is very likely good enough. For example, to have a 99% chance of detecting a correlation of |0.6| or larger only requires 35 data points, 30 if you have a 1-tailed hypothesis as we do. 78 fighters with a 1 tailed test should give us 99% power to detect correlations as low as |0.41|.
I manually went through all fighter pages and wrote down the armspan and leg length data into Excel. The data can be found on the open science foundation page for my armspan article (I didn’t really know where else to put it). I did a simple analysis and thought; heck, why not make this into an R tutorial for the interested!
First we download the data from my OSF directory, and read it into R:
download.file(‘https://osf.io/4d2pv/download','arm_leg_PFL.csv')
data= read.csv(‘arm_leg_PFL.csv’)
First let’s make histograms for the 2 dimensions, to see how they’re distributed, how they vary (remember you’ll need these packages installed first!):
library(ggplot2)
library(gridExtra)

plot1 = ggplot(data, aes(x = armspan))+
geom_histogram(binwidth = 1, fill = ‘darkolivegreen’)+
ggtitle(‘Histogram of fighter armspans (inches)’)
plot2 = ggplot(data, aes(x = leg_length)) +
geom_histogram(binwidth = 1, fill = ’navy’)+
ggtitle(‘Histogram of fighter leg lengths (inches)’)
grid.arrange(plot1, plot2, nrow=1)
#data-science #r #data-visualization #mma #data-analysis
