Airbnb can be considered the largest hotel chain in the world, although the company does not own any of the real estate listed on their website!
Connecting travelers worldwide with hosts that are willing to earn extra money from renting their places, Airbnb became a huge success since it was founded, in 2008.
Around 10 years after it was established, the company has already hosted over 300 million clients and counts with about 7 million listings worldwide, fiercely competing with traditional hotel chains.
Being a data-driven company, Airbnb shares a lot of data for free through the website Inside Airbnb.
We are going to analyze the data of the city of Vancouver, utilizing Python to build data science algorithms, and extract information regarding prices, neighborhoods, rental types, and the correlation between some of these variables.
The dataset
For our exploratory analysis, we are going to utilize the file listings.csv, downloaded from Inside Airbnb. This dataset consists of 5806 entries and 16 variables, such as price, neighborhood, the minimum number of nights, among others.
Dealing with outliers
After a preliminary analysis, we noticed that some variables were oddly distributed. As an example, the distribution of priceand minimun_nights show evidence of the presence of outliers, distorting our data.

Fig 1. Descriptive analysis of the variables “price” and “minimum_nights”
Considering the descriptive analysis, we can confirm our hypothesis. Notice that 75% of price values are below $200.00 but we have a maximum value of $12,999.00. As for the variable minimum_nights, we can also notice some disparity. The value of the third quartile is 30 nights while the maximum value found was as high as 998 nights!
Going further with the outlier analysis, we discovered that we have a meager 0.49% of prices over $1,000 and 6% of values higher than 30 days for the minimum amount of nights. Therefore, to keep the data cleaner we are going to drop values that surpass those mentioned above.
Variable distribution and correlation
After cleaning our dataset and dealing with the outliers, let’s see a histogram of the distribution of each numeric variable:

Fig 2. Histograms containing the distribution of each numeric variable
As for the correlation between the numeric variables, we plotted a heatmap to help us visualize how the attributes relate to each other:
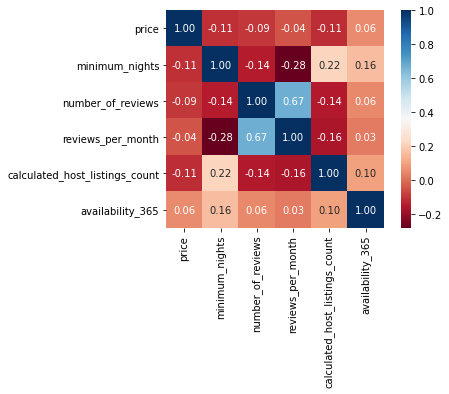
Fig 3. Heatmap showing the correlation between variables
Aside from an expected positive correlation between number_of_reviews and reviews_per_month, we can see that no other variables are significantly correlated.
Interesting questions answered by our dataset
After handling our dataset and doing some exploratory analysis, we are able to get some insights from our data and answer some interesting questions.
Which type of place is the most rented in Airbnb?
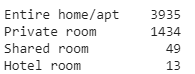
Fig 4. Available places for renting per type
As we can observe from the two images, entire homes count for the majority of places available for rent in Vancouver

Fig 5. The proportion of each type of place
They represent 72% of the total, while private rooms, with 26%, also have a considerable share.
What is the average rental price?
The average rental price for Airbnb in Vancouver is $164.92.
What is the average of minimum_nights?
As for the average minimum number of nights asked by hosts, after eliminating the outliers we found 9.31.
Which Vancouver neighborhood has the highest rental prices?
Let’s see what are the 10 most expensive neighborhoods to rent a place in Vancouver:
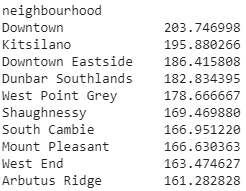
Fig 6. Average rental price per neighborhood — The 10 most expensive
As we can see, Downtown Vancouver has the most expensive properties in Airbnb.
To help us visualize the prices around the city, let’s display a scatter plot showing the properties distributions. Notice that the majority of places are under the $200,00 mark per day, as we saw in Fig 1.
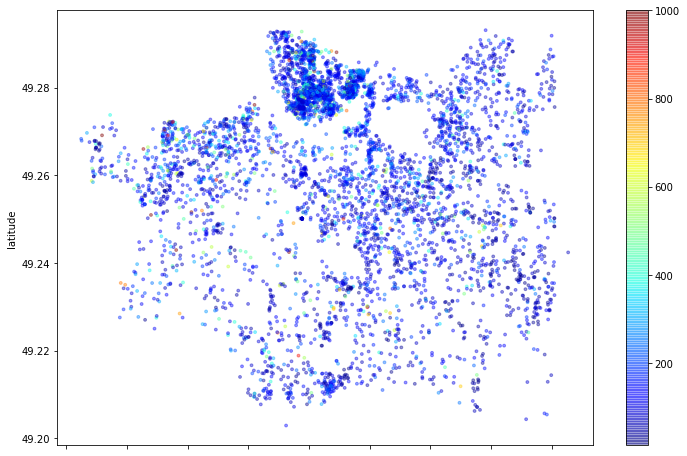
Fig 7. Scatter plot of Vancouver, displaying the properties around the city and their price marks
#data-analysis #data-science #airbnb #data analysis