In the previous article D3-Force Directed Graph Layout Optimization in Nebula Graph Studio, we have discussed the advantages that D3.js has over other open source visualization libraries in custom graph and the flexible operations on the document object model (DOM) with D3 js. Given the customizability of the D3.js, is it possible to achieve whatever I want by using it? In this article, I will show you how to take full advantage of the flexibility of D3.js to realize on-demand functions which are not supported by D3.js itself.
Building the D3-Force Directed Graph
Here I won’t elaborate on the principle of the particle physical movement module of the d3-force. You can refer to our previous post if you are interested in this topic. Instead, I will focus on the practice of visualization in this article.
Now let me show you how I developed some new functions with the help of D3.js to better analyze the graph databases. Firstly, let’s build a simple relationship network with the d3-force directed graph.
Shell
1
this.force = d3
2
.forceSimulation()
3
// Allocate coordinates for the vertices
4
.nodes(data.vertexes)
5
// Link
6
.force('link', linkForce)
7
// For setting the center of gravity of the system
8
.force('center', d3.forceCenter(width / 2, height / 2))
9
// The gravity
10
.force('charge', d3.forceManyBody().strength(-20))
11
// The collision force, for preventing the vertices from overlapping
12
.force('collide',d3.forceCollide().radius(60).iterations(2));
We can get the following vertices and relationships graph with the preceding code.
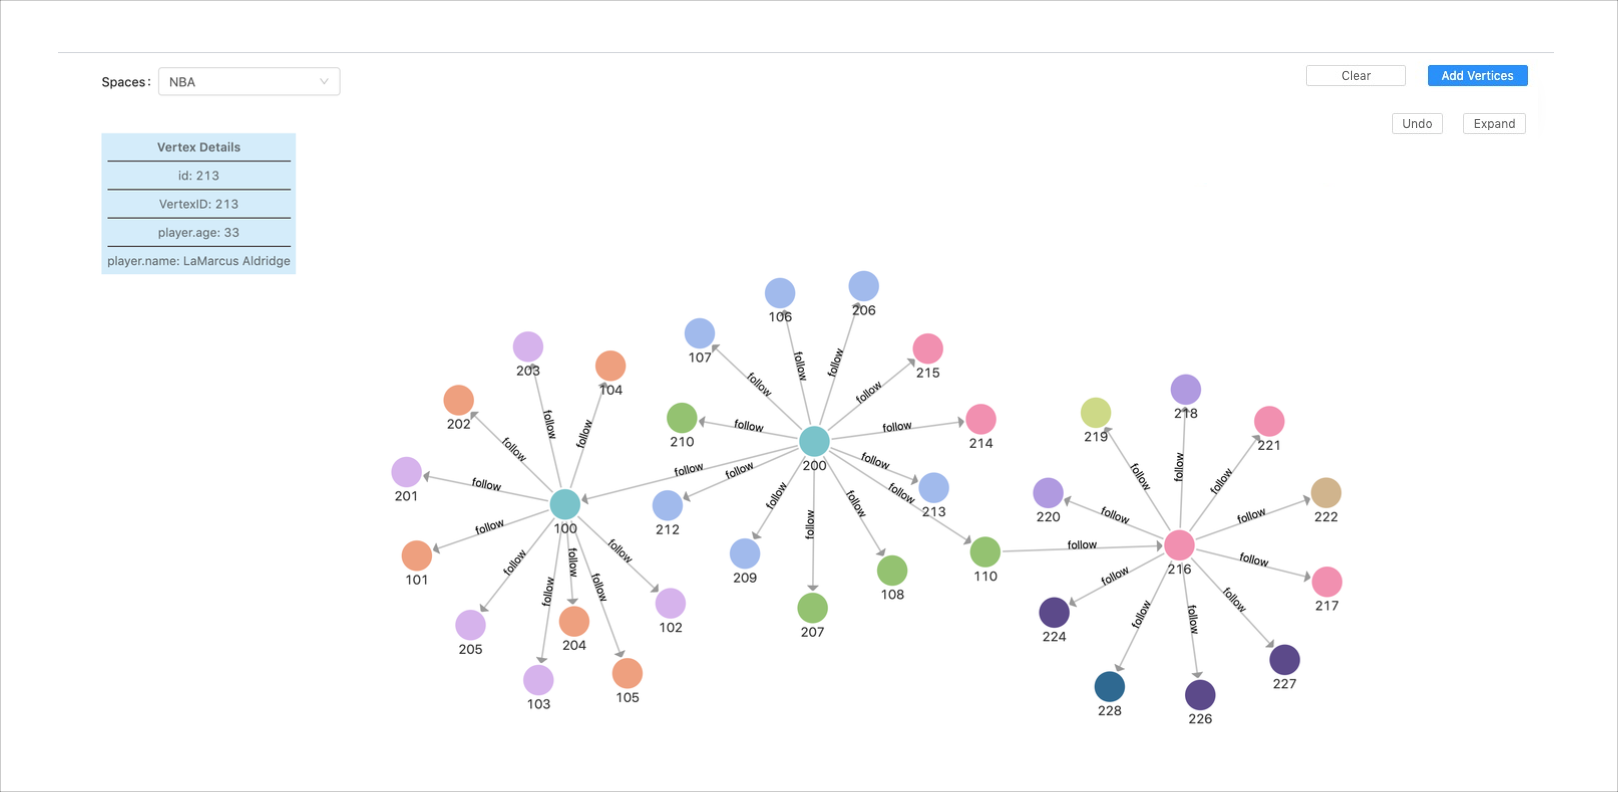
The preceding figure is a screenshot of the exploration tab of the graph visualization tool, Nebula Graph Studio. There you can select a certain vertex as the starting point of exploration by finding other vertices that are associated with it. For example, in this figure, vertex 100 and vertex 200 are connected with a single directed follow relation.
The problem is, if I have a super vertex which have thousands of edges, or if I want to display multi-hop query results, then the visual graph needs to display vertices and edges in huge density. It is also difficult to locate a specific vertex. Chances are users want to analyze only part of the data in the graph instead of the whole graph. Deleting the selected data will be a great solution to this scenario. You just delete the unwanted data and keep what you want.
Deleting the Selected
Before introducing how this function is implemented, let me begin with the native APIs provided by D3.js. Yes, I mean the enter() mentioned in the previous post and exit() I didn’t cover last time. Here are some descriptions from the documentation:
_When binding data, it’s likely that the array has more (or less) elements than the DOM elements. Fortunately D3 can help in adding and removing DOM elements using the _.enter_ and __.exit_. _If the array is longer than the selection there’s a shortfall of DOM elements and we need to add elements with __enter_. _If the array is shorter than the selection there’s a surplus of DOM elements and we need to remove elements with __exit_. There are three cases in data binding:
• A shortfall of DOM elements
• A surplus of DOM elements
• The array is equal with the DOM elements
According to the documentation, it seems simple to implement the “deleting the selected” function. I was so optimistic that I thought simply operating on the data level was enough. Thus I deleted some vertices directly from the vertices data, then removed the extra element with the d3.select(this.nodeRef).exit().remove() API. Now let’s check the result of this operation:
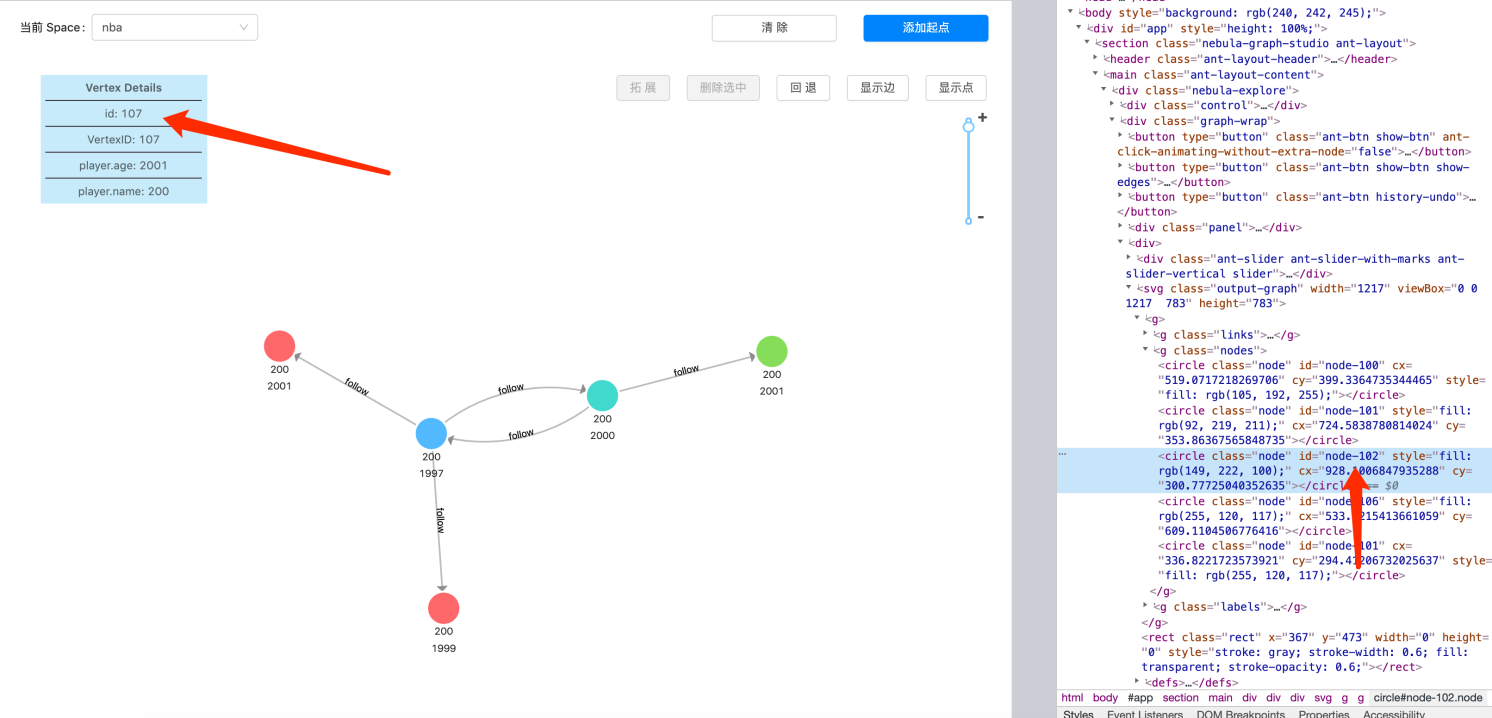
The targeted vertices are deleted as expected. However, other vertices are messed up because the colors and properties of the vertices are inconsistent with the current DOM vertices. Why? I checked the documentation more carefully and was inspired by an idea. Why not print the exit().remove() vertices out to see which vertices are removed?
Sure enough my guess has been confirmed. It’s the length change of the listening element that triggers the enter() and exit() function. That is to say, if two elements are taken out, the exit() will be triggered. But it won’t process the data you want to delete. Instead, it processes the last two vertices of the current data. In another word, enter() and exit() are triggered by the data length. However, take exit() as example, when D3.js detects any data length changes, say N, it will cut all the elements between the last N and the last element. On the contrary, enter() will add N pieces of data after the last element in the array.
Therefore, although the vertices are deleted from the previously returned data (apparently they are not the last element in the current array), the d3.select(this.nodeRef).exit() will locate the last element in the existing graph. This is totally a mess. So how to deal with this issue?
The D3.js recommends that you solve this problem with the officially provided merge function. But in our case, since we know the IDs of the vertices to be deleted, we operated directly on the DOM.
Here’s my simple yet effective solution. Since the exit() API can’t meet our requirements, I will process the vertices to be deleted separately. First I need to locate the DOM where the deleting operation is actually performed. To achieve this, I need to bind an ID to each vertex when rendering. Then I traverse. Find the corresponding DOM of the deleted vertices based on their ID. Following is my code:
#data visualization #d3.js #graph visualization #nebula graph