This blog is a continuation of my previous work¹, in which I talked about how I gathered product reviews and information through web scraping. I will now explain more about how I built the product recommendation system.
The Goals of this project were to:
- Gather product information and reviews data from BackCountry.com through web scraping using selenium, beautifulsoup (Part I)
- Perform an exploratory data analysis using ScoreFast™ platform
- Convert text data into vector
- Build a KNN predictive model to find the most similar products
- Run a Sentiment Analysis on product reviews
- Use each review’s sentiment score to predict its review’s rating
- Generate word clouds to find the customers’ pain points
Exploratory Data Analysis
Exploratory Data Analysis (EDA) is one of the crucial steps in data science because it allows us to understand the data better. ScoreFast™ enables users to create data reports using SQL queries and build dashboards using simple clicks. If you are interested to know more about our product, please check out our website.
I first defined the EDA questions I would like to answer with the data, then I created some visualization using both the ScoreFast™ platform.
Here are some EDA plots:
➡️ Dress Price Distribution
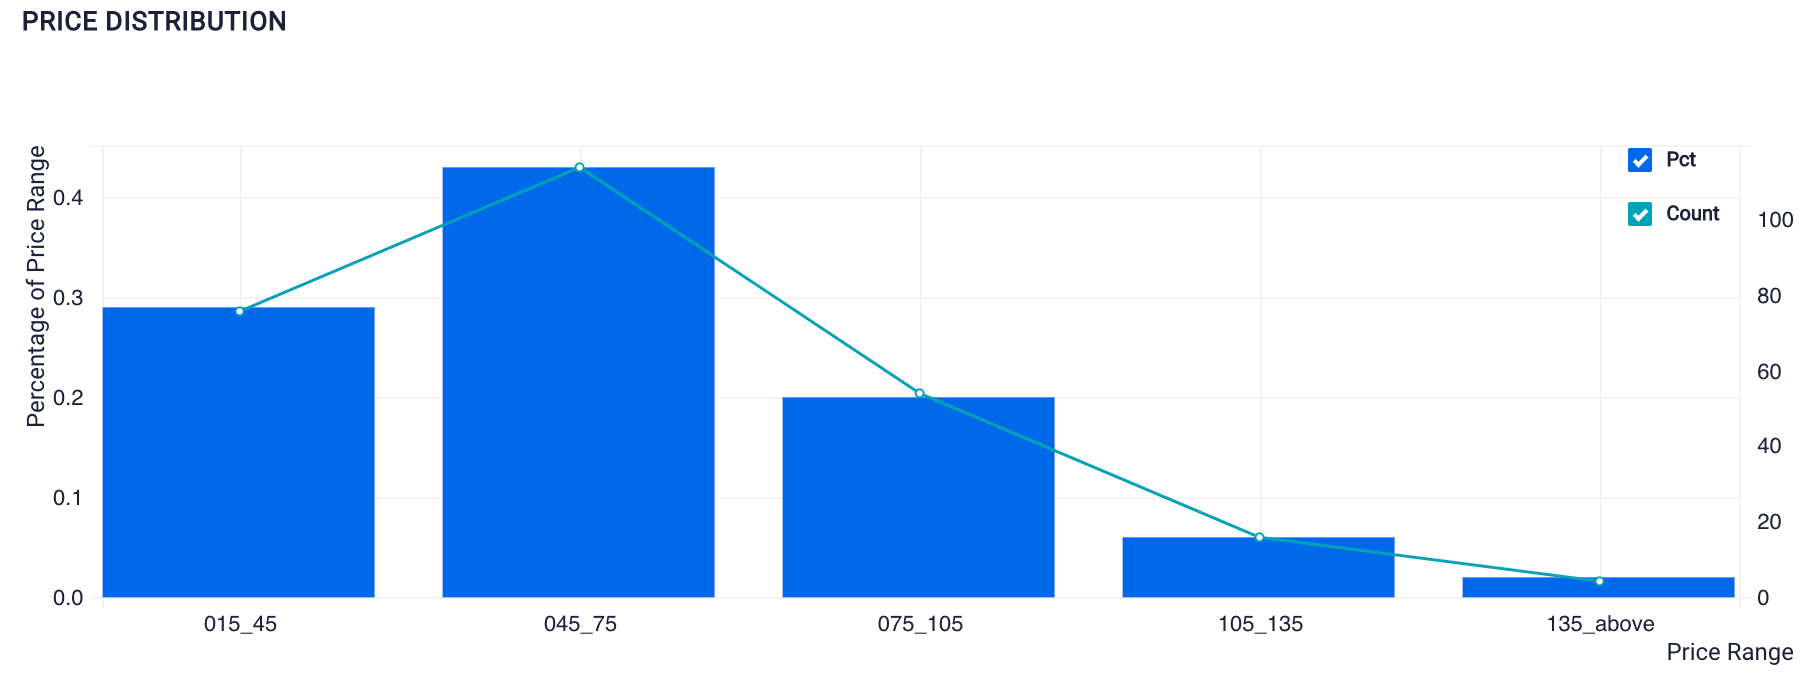
Visualization Created Using SQL on ScoreFast Platform (by Author)
From this plot, we know that almost half of the dresses listed on Backcountry.com are between $45 to $75 price range.
➡️** The Average price for Each Brand**
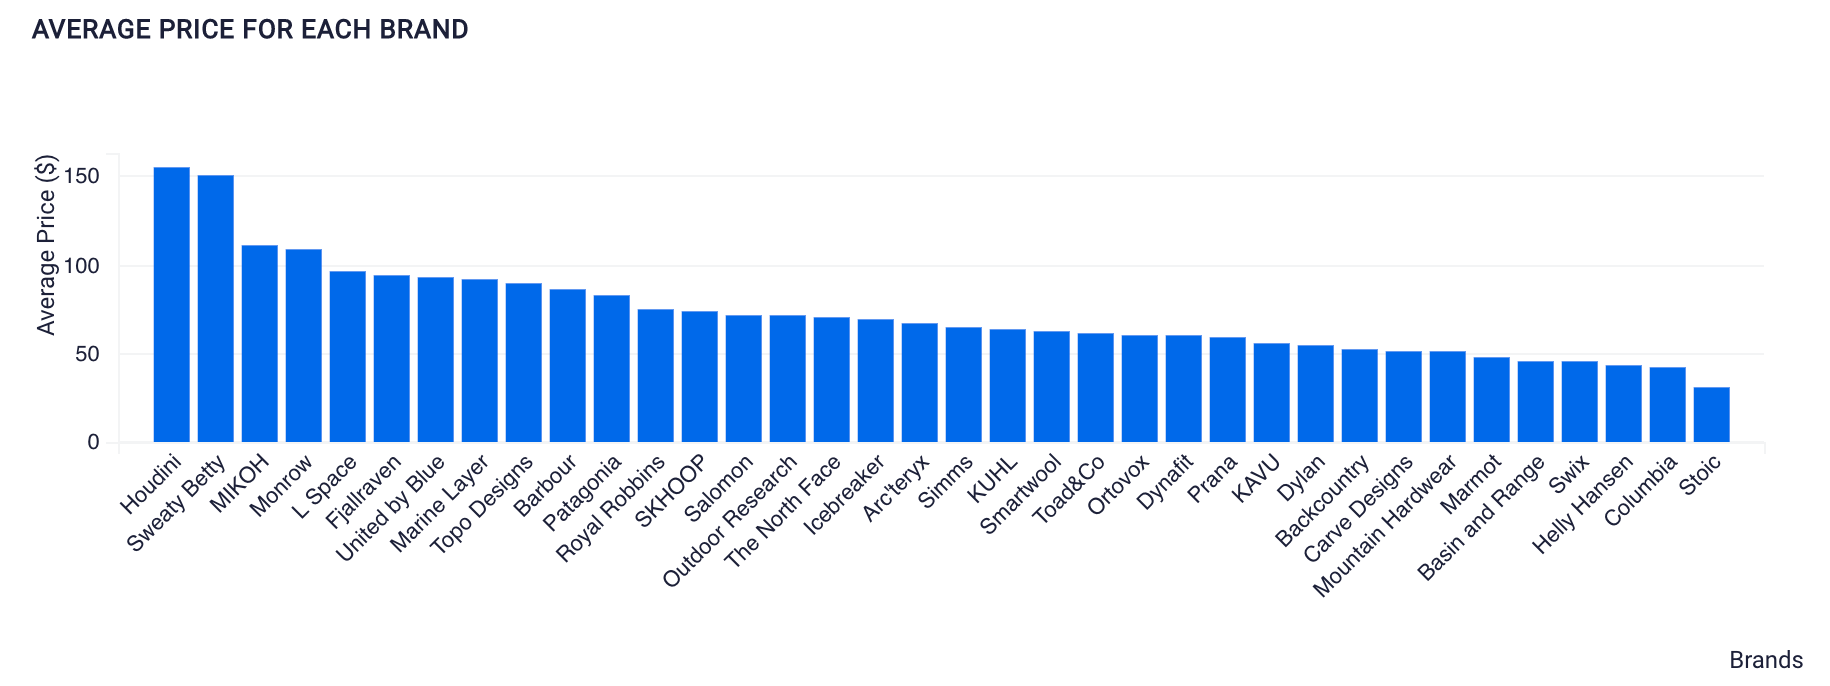
Visualization Created Using SQL on ScoreFast Platform (by Author)
We can see that Houdini has the highest brand’s average price, and Stoic has the lowest. We can conclude that Stoic dresses are more affordable while Houdini dresses are pricier.
#web-scraping #startup #business #recommendation-system #data-science