Descriptive Statistics in Python
Descriptive statistics include those that summarize the central tendency, dispersion, and shape of a dataset’s distribution.
- Measure of central tendency
- Measure of spread/dispersion
- Measure of symmetry [ will save this for the future post]
Dataset
Imported all the libraries needed for statistical plots and created a dataframe from the dataset given in bmi.csv file.
This dataset contains Height, Weight, Age, BMI, and Gender columns. Let’s calculate descriptive statistics for this dataset.
The code used in this project is available as a Jupyter Notebook on GitHub.
import numpy as np
import pandas as pd
import matplotlib.pyplot as plt
% matplotlib inline
df=pd.read_csv("bmi.csv")
df
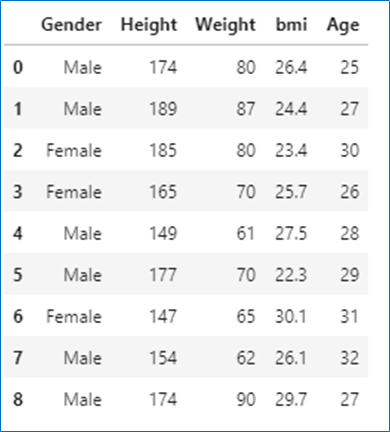
DataFrame
Measure of Central Tendency
Measure of central tendency is used to describe the middle/center value of the data.
Mean, Median, Mode are measures of central tendency.
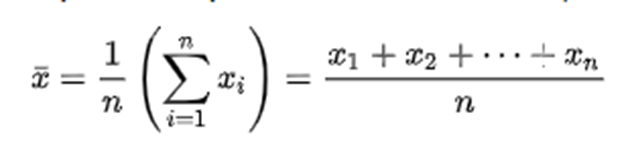
1. Mean
- Mean is the
average valueof the dataset. - Mean is calculated by adding all values in the dataset divided by the number of values in the dataset.
- We can calculate the mean for only numerical variables
Formula to calculate mean
#programming #python3 #pandas #python #data-science

6.70 GEEK