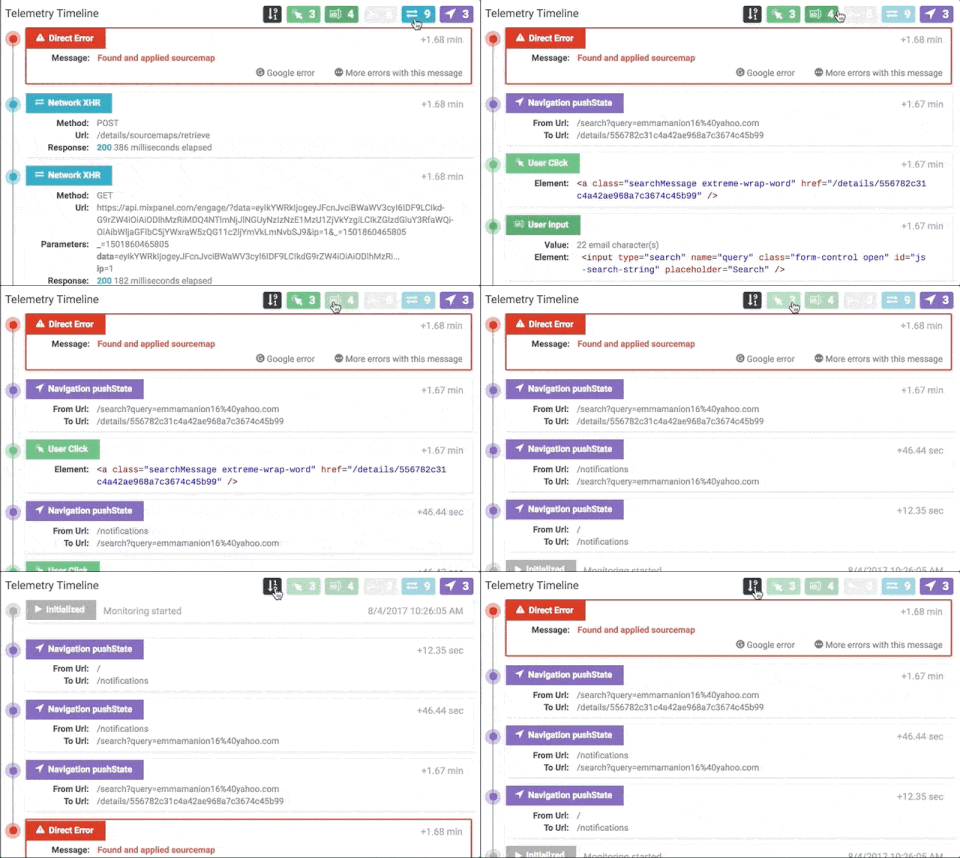
We started by flipping the sort-order of the Telemetry Timeline to show the error first and enumerated through prior events. This seemed to make sense for most errors, as the events most relevant to the error likely occurred last. We also gave you control to flip the order back.

Error timelines get noisy, especially if your application has a lot of Network or Console chatter. So we gave you control to hide event types, which we hope will make it easier for you to discover the root cause faster.
Within the timeline, we’ve also expanded the information we provide about Network events, differentiating XmlHttpRequest and Fetch requests. And we parse out query string parameters to make it easier to understand each request.

Multiple errors often happen within a single page view. Understanding them often depends on earlier errors. We made it easier to quickly see what the previous error was by including it directly in the Timeline.
Sometimes there can be dozens (or hundreds) of errors to navigate, and this would be tedious to navigate one-at-a-time. To address this, we built a pagination control just below the Timeline to quickly show you the scale of problems during the session, and let you navigate them easily.
- Step 1. Get visibility into JavaScript errors
- Step 2. Narrow down the JavaScript error play ground
- Step 3. Make the JavaScript Stack trace human readable (Source Maps)
- Step 4. Reproducing the JavaScript error leveraging the user’s clickpath
#programming #web-development #javascript
