Top 6+ React Native Chart/Graph Libraries that You Should Know
In this tutorial, we will explore top 6+ of React Native chart/graph libraries and evaluate them to determine which ones are most suitable for specific requirements.
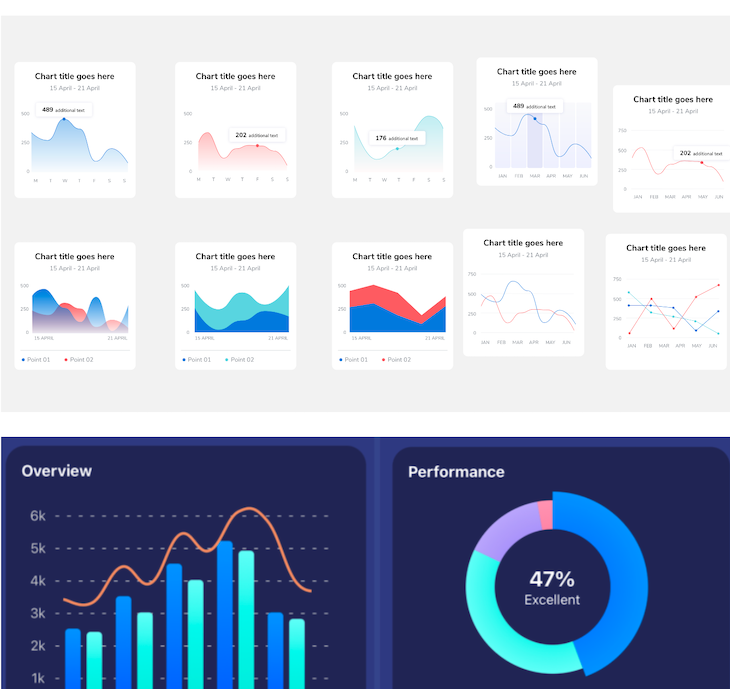
Charts and graphs are essential when you want to display statistical data retrieved from a database in a meaningful way. Knowing which data visualization library is optimal for the mobile app you are working on is the first step in this process.
Cross-platform mobile app framework React Native has many open source libraries that help to represent data in charts and graphs. When choosing a React Native chart/graph library, several criteria must be considered.
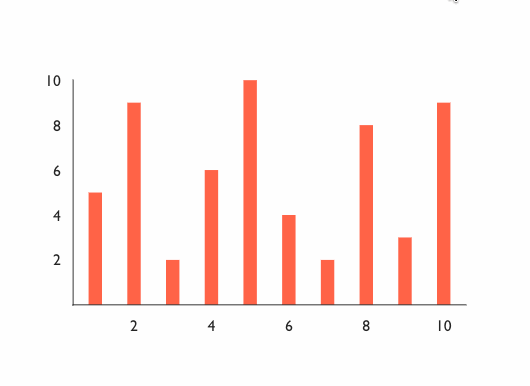
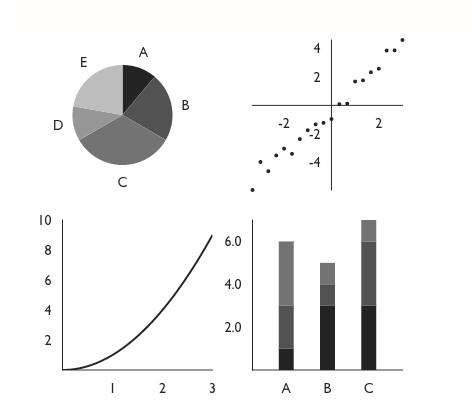
The charting library you pick should provide a variety of chart types to choose from, such as bar charts, line charts, and pie charts, etc. The library should also be easy to implement and customize, with a user-friendly API. Additionally, it should support animated transitions, making the charts visually appealing and engaging for the user. And finally, the charting library should be lightweight to ensure that the app’s performance is not adversely affected.
In this post, we will explore a range of React Native chart/graph libraries and evaluate them based on the criteria mentioned above to determine which ones are most suitable for specific requirements.
Contents:
- react-native-charts-wrapper
- react-native-svg
- react-native-chart-kit
- react-native-pie-chart
- react-native-responsive-linechart
- react-native-echarts-wrapper
- Victory
- react-native-gifted-charts
- Which charting library is the best option?
react-native-charts-wrapper
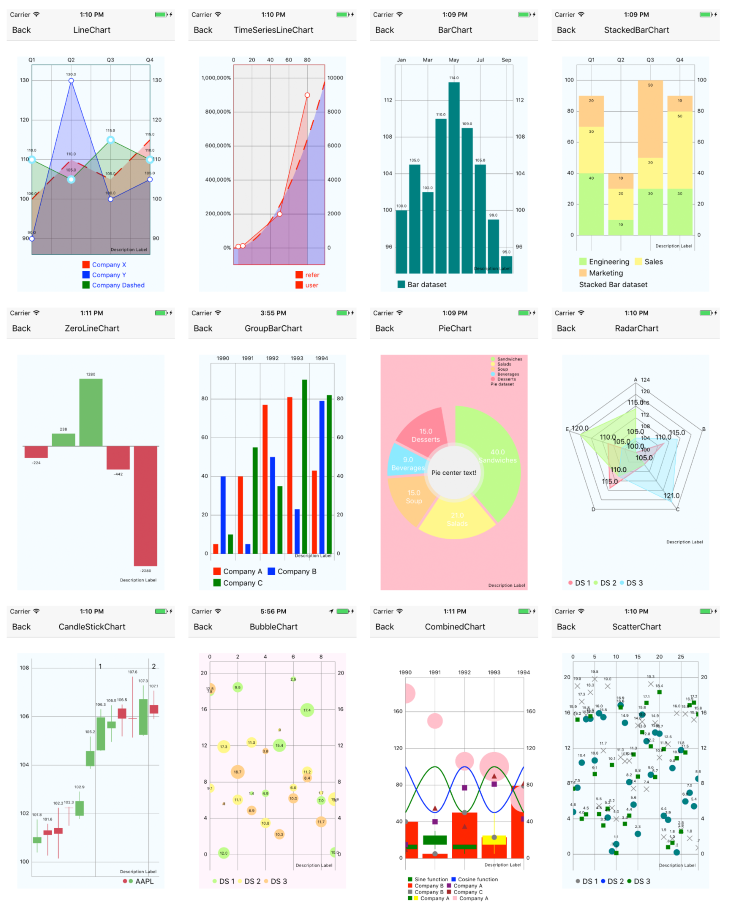
react-native-charts-wrapper is an open source library that supports both iOS and Android devices. It is based on native charting libraries such as MPAndroidChart and iOS charts. It also has a different number of supported chart types, including line, scatter, bubble, pie, radar, bar, combined, and candlestick.
As a library, react-native-charts-wrapper is well documented and explains how to get integrated into a new React Native app with a step-by-step tutorial. It also highlights the major conventional differences between iOS and Android. For example, the color’s alpha on Android is between the range of zero to 255, and on iOS, it is zero to one. This information is helpful for someone who is getting started with a chart library in their mobile app for the first time. react-native-charts-wrapper is actively maintained on GitHub.
react-native-svg
react-native-svg provides SVG chart support for React Native apps on both iOS and Android devices and a compatibility layer for the web. react-native-svg is used as a dependency to render graphs and charts. It uses the D3.js library to create SVG paths and calculate coordinates.
What started as a side project now supports a variety of chart patterns as ready-to-use components. Here is the list of patterns available with react-native-svg:
- Area
- StackedAreaChart
- Bar
- StackedBarChart
- Line
- Pie
- Progress circle
- YAxis
- XAxis
Because all of these components come with the library itself, react-native-svg also provides a common set of props for each of the components to customize the chart and represent the data in its accurate form. This set of common props makes it easier to use in a real-world scenario.
react-native-chart-kit
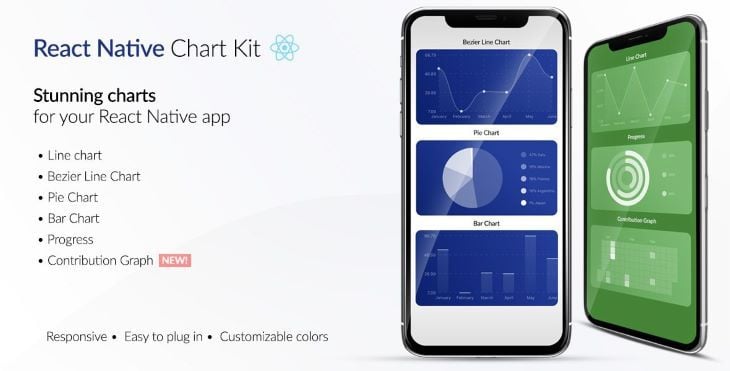
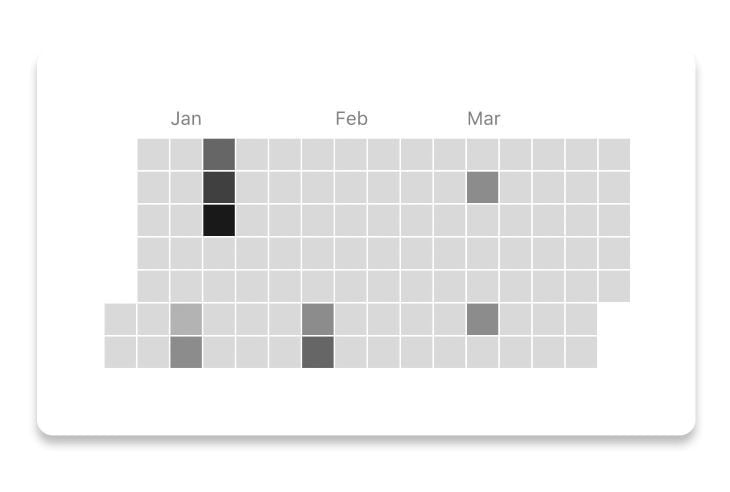
A charting library that supports both Expo apps and React Native vanilla apps, is something worth giving serious consideration. react-native-chart-kit is built on top of famous open source projects such as react-native-svg, paths-js, and react-native-calendar-heatmap. It supports patterns such as line, bezier line, pie, progress ring, stacked bar, and contribution graph (also known as a heat map). Some of the patterns that react-native-chart-kit supports are unique when compared to other libraries mentioned in this article. Each of the patterns has its own set of props, which makes it easier to customize data on a mobile app screen:
Apart from some unique patterns, react-native-chart-kit also allows you to render a responsive chart by using the Dimensions API from React Native by calculating the width of the device’s screen. Each chart component also accepts a style prop that can be applied to the parent SVG or View component to customize the default styles of that chart pattern.
react-native-pie-chart
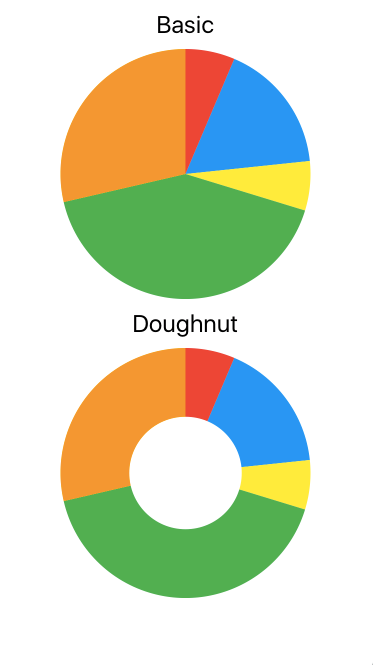
react-native-pie-chart is an open source library that is simple to use and offers two different variants to display data in the form of a pie chart. It is useful for scenarios where you are required to represent data in a pie chart but want to keep the bundle size of your app small. Most libraries, as discussed in this article, offer a variety of components and patterns that are usually going to increase the overall bundle size of the app.
react-native-pie-chart offers a set of props to apply custom styles or switches between the two shapes it offers. This makes it easy to configure and understand.
CLCchart
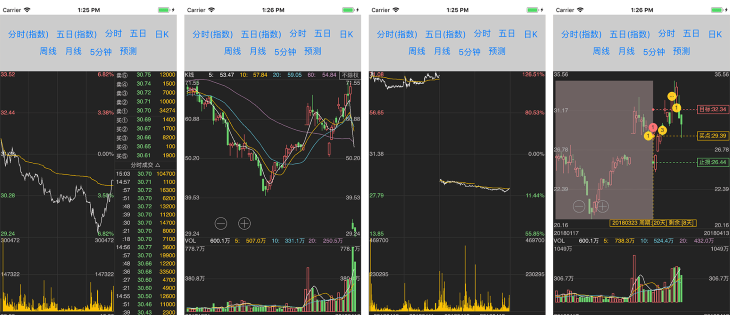
Constantly changing data that has to be accurate for the end user to analyze is one of the most difficult kinds of data to portray on a mobile app screen. An example is stock market data. CLCchart is a cross-platform UI charting library that specializes in representing stock data in the form of charts using the canvas. It supports both web and cross-platform mobile app frameworks such as React Native. CLCchart is easy to install and integrate with the React Native app as well with just one line of execution from the terminal window.
CLCchart depends on a cross-platform rendering engine called GCanvas. This engine was developed by a team of developers at Alibaba for mobile devices and is based on OpenGL. To use it in React Native apps, follow these instructions to install it and integrate it on both iOS and Android platforms.
react-native-responsive-linechart
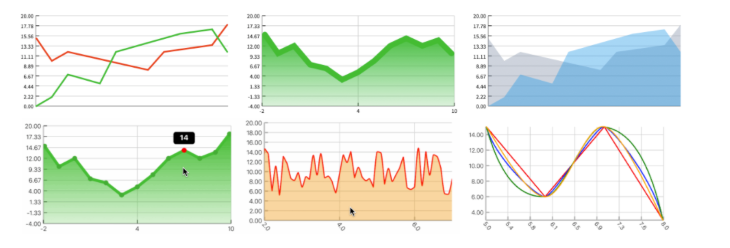
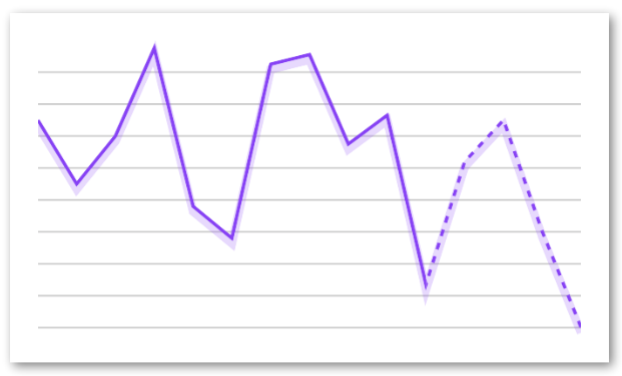
Like react-native-pie-chart, react-native-responsive-linechart is particular in representing data in the form of lines on a mobile screen. Written completely in TypeScript, react-native-responsive-linechart has a composable API for different types of representations of a line chart. It supports adding tooltips and a large number of data points.
react-native-responsive-linechart depends on only two external libraries: react-native-svg and react-native-gesture-handler. By enabling the latter dependency, it allows this library to support scrollable charts by setting a viewport prop. Lastly, because it doesn’t depend heavily on other libraries and supports only one type of charting pattern, react-native-responsive-linechart has a total package size of only 62 kilobytes (unzipped).
react-native-echarts-wrapper
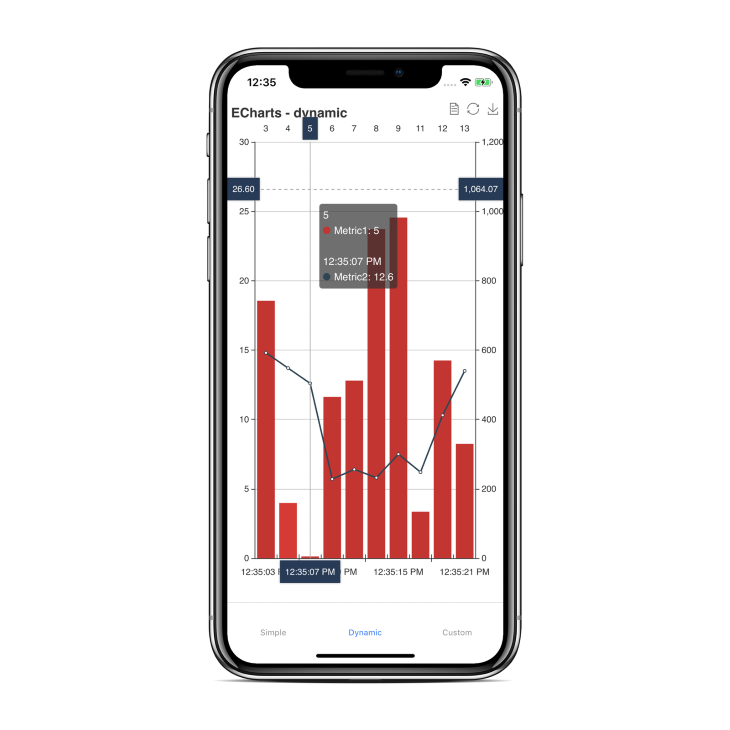
react-native-echarts-wrapper is a charting framework that wraps around popular echarts. It runs on webview and explicitly depends on react-native-webview. With react-native-echarts-wrapper, it is possible to create and represent a complex set of data with interactivity for each data representation on the app screen.
Because it uses webview, react-native-echarts-wrapper has support for both vanilla React Native apps and Expo apps. It is not easy to make two-way data communication between the chart that is running on the JavaScript thread in the webview and the React Native JavaScript thread. So this library leverages the webview method called sendData to communicate with the React Native JavaScript thread. Please note that when using this method, the data in string format can only be sent.
Victory
Built and maintained by a team of developers at Formidable labs, Victory is a charting library that supports different patterns in modular forms and ready-to-use components for both React and React Native applications. The React Native variant is known as Victory Native. All of the components provided by Victory can be used to visualize data in various formats and support complete customization in terms of styles and behavior. It is easy to install and integrate this charting library in a React Native app. The only peer dependency it has is react-native-svg, which also requires being installed explicitly.
Apart from a different set of chart components that Victory supports, there are many perks the library comes with. One is the support of animations and transitions. With the help of an animate prop, the animation changes can be applied to a VictoryChart component. The animation is possible using d3-interpolate, which is a collection of interpolation methods. The default transitions on a VictoryChart component are customized using props such as onEnter and onExit:
The next advantage that victory has over other libraries mentioned in this article is the support for material and grayscale design themes. A set of colors can be defined in the form of an array, the typography to represent the data such as the font family, font size, and letter spacing. To label a specific data set or a representation of data in a chart, VictoryTooltip is also available to add tooltips to charts.
Victory offers many configuration options and information on how to create your own custom chart components:
react-native-gifted-charts
react-native-gifted-charts is a powerful library used for creating visually appealing and interactive charts in React Native applications and with over 2k weekly downloads on the npm registry, it has become increasingly popular among developers.
react-native-gifted-charts comes with everything you need to create beautiful and animated bar, line, area, pie, donut, and stacked bar charts in React Native.
react-native-gifted-charts is clickable and scrollable, includes 3D and gradient effects, and also provides smooth animations that can be implemented using the LayoutAnimation prop. react-native-gifted-charts enables you to add animations to your charts that occur both when the chart is initially loaded and when its values are changed. This means that when a chart’s value is updated, users will experience a smooth layout transition rather than a sudden change.
One of the key benefits of using react-native-gifted-charts is its simplicity. Developers can easily integrate it into their projects and start creating charts in a matter of minutes. The library is also highly flexible, allowing developers to easily modify and extend its functionality to suit their needs.
Which charting library is the best option?
Among the options available, react-native-gifted-charts stands out as my personal favorite and the best choice for several reasons. It meets all the criteria we established for a great React Native charting library, and its implementation and customization are straightforward. In addition, it features smooth transitions when values change, ensuring a seamless user experience. Nonetheless, selecting the most suitable charting library ultimately depends on your specific project requirements, and the decision should be based on a comprehensive evaluation of available options.
Conclusion
The open source libraries included in the list are either based on personal experience or those which are actively maintained. The motive of these UI component libraries is to let you represent statistical data in its accurate form and help with the app development process. Some of the components and animations offered by these libraries are hard to reinvent considering the cost of development of the mobile application.
If you are familiar with any other charting library in the React Native ecosystem that is not mentioned in this post, leave it in the comment section below and tell us why you like it.
Source: https://blog.logrocket.com
#reactnative