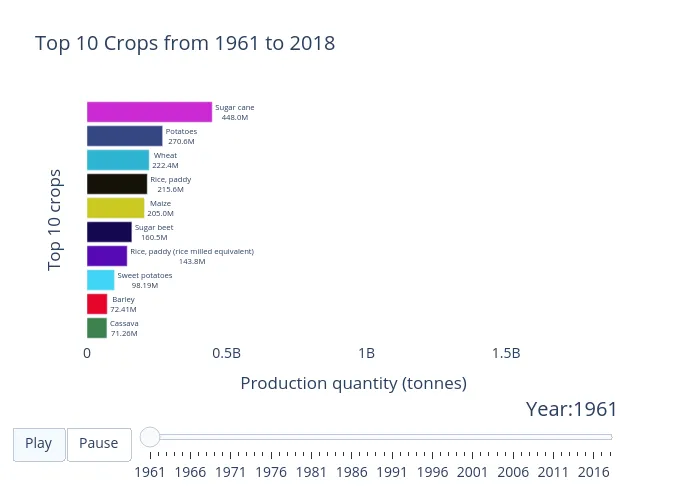
Have you ever seen these racing bar plots for ranking things or people over time? They are getting popular, they are fun to look at and they enable seeing who or what has topped a certain ranking over time. You might have seen the ranking of countries by COVID19 cases in 2020, or the ranking of the richest people from Rockefeller to Jeff Bezos. Whatever sort of ranking you are into, today you will learn how to make a racing plot of your own using Python and Plotly! — package provided too :)
Acknowledgments
- Amanda Iglesias Moreno wrote a Medium post in 2017 on making a Bar chart race plot with the top baby names in Barcelona. I learned quite a bit from that post, my intention in this article is to use what I have learned from her post and other resources to make code that can be used for any specific use case.
- This Plotly tutorial offers all the code to make an animated Gapminder scatterplot. While the example is very rich, little to no code is explained. I am writing this post to help others understand what all the Plotly arguments mean. When I use “weird” Plotly arguments I will explain what they do in simple terms in the code comments.
#programming #data #python #visualization #plotly
20.75 GEEK