MongoDB Charts now comes with a sample dashboard full of charts. This serves as a sandbox allowing all users, new and experienced, to find inspiration for visualizing their own data, breakdown pre-made charts, and see Charts’ capabilities without the need to upload their own data.
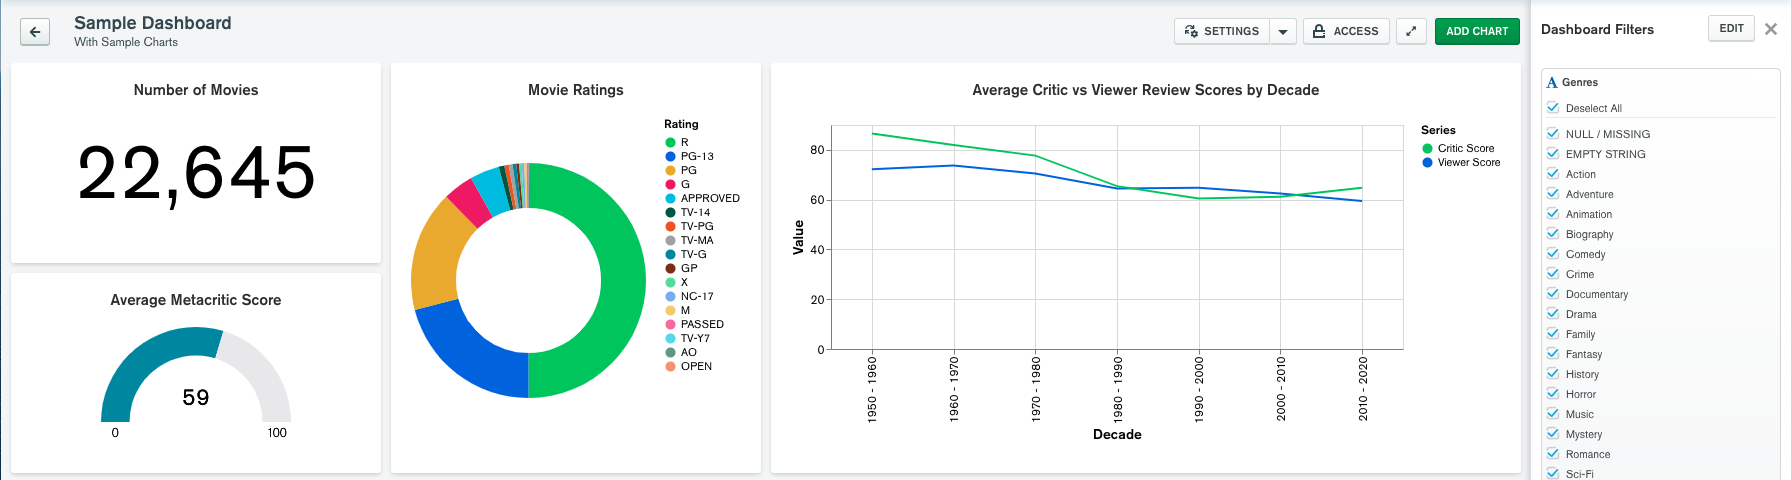
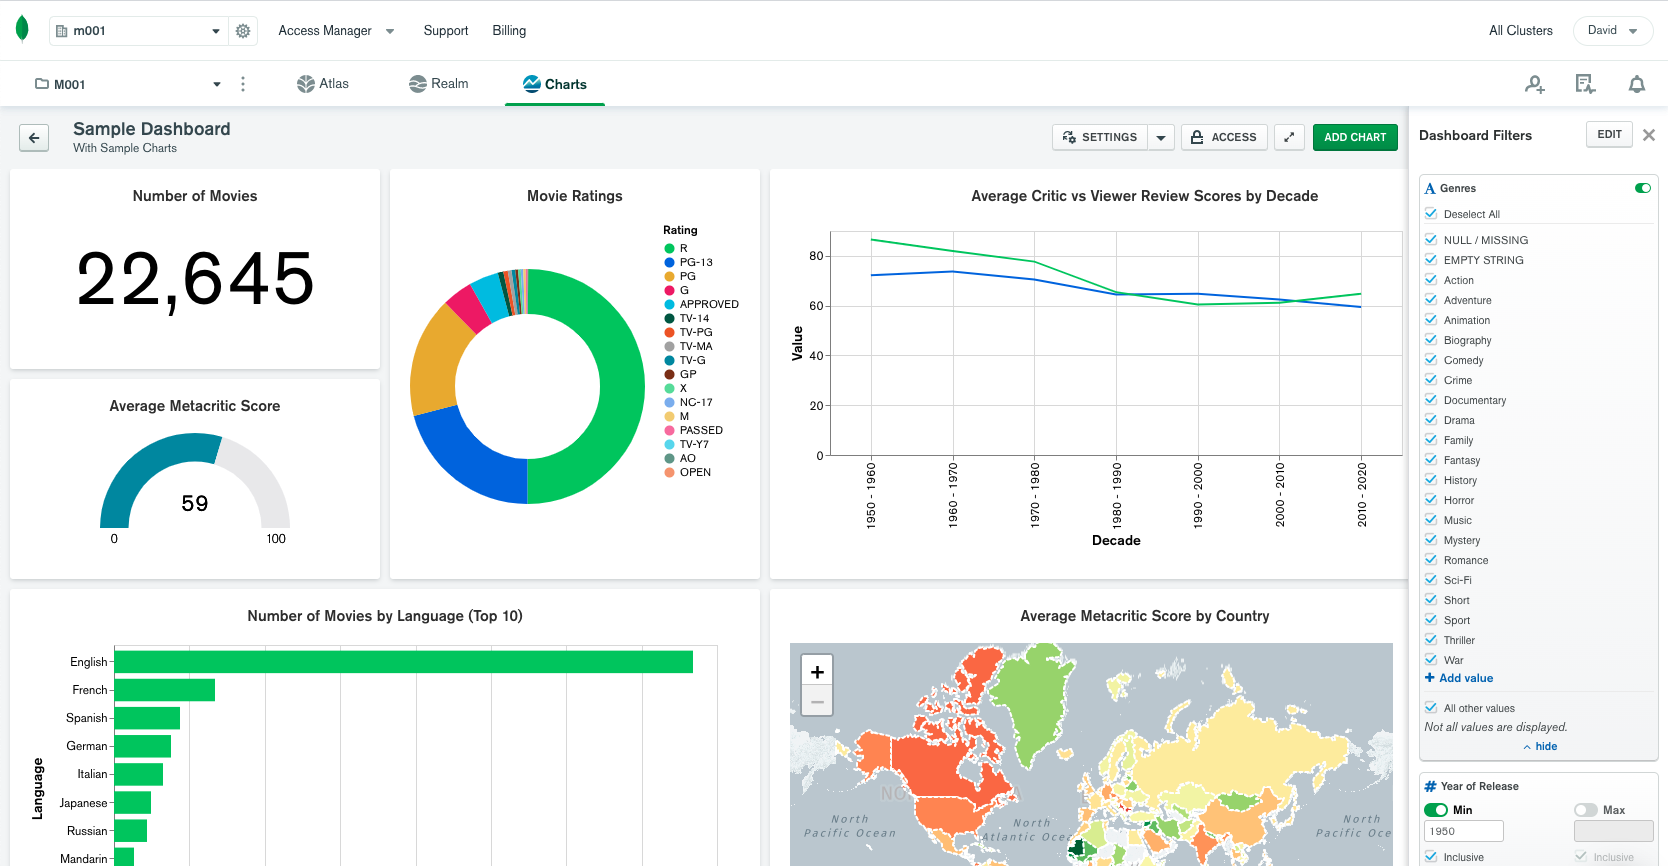
Whether you’re a newcomer to MongoDB or you’re already an avid user of Charts, the new MongoDB Charts sample dashboard has something for you, and it is now ready for you to explore! The sample dashboard includes 10 pre-made visualizations from a sample movie dataset, which you can access without needing to upload anything to your own cluster. The beauty in this dashboard is that you can quickly and easily see how various visualizations are made in Charts.
Creating the sample dashboard
You’re now able to quickly see various types of visualizations, filtering capabilities, and even make your own charts with sample movie data without the need to connect to a database or upload data. We’ve also simplified the process for getting started with Charts.
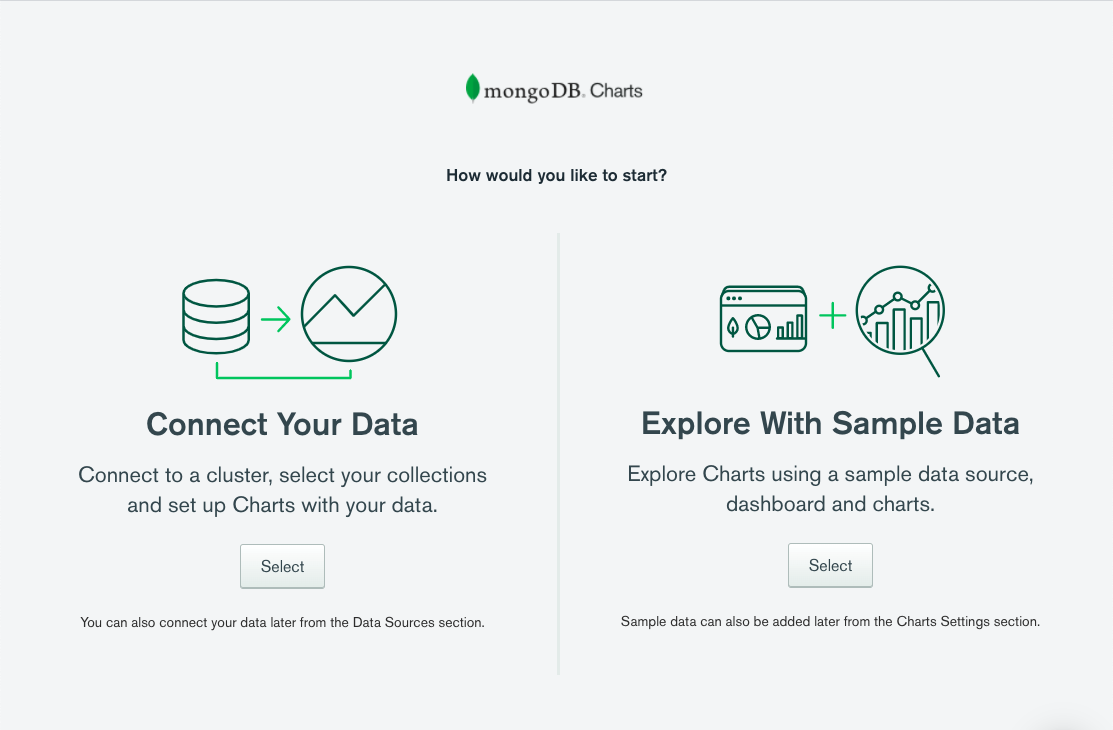
- If you’re new to Charts, you’ll see a welcome screen with two prompts upon launching Charts from MongoDB Atlas: Connect Your Data and Explore with Sample Data. Simply choose the second option and the sample dashboard will be ready and waiting.
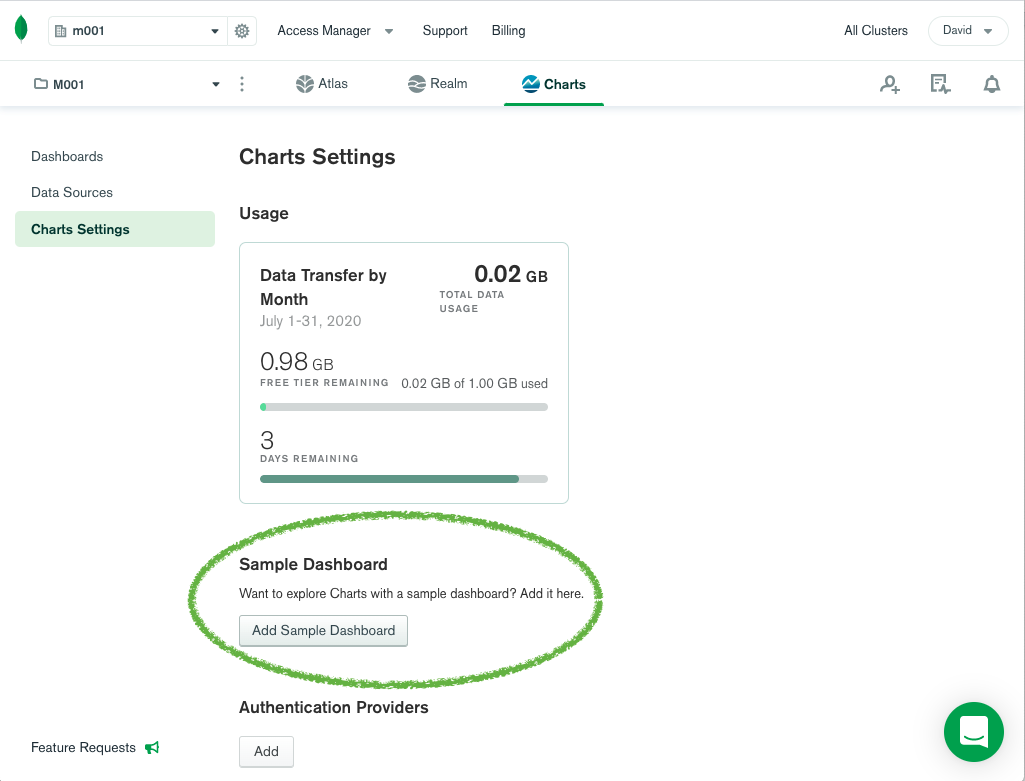
- If you’ve used Charts before, you’ll need to add the sample dashboard. You can do this with a single click from the Charts Settings menu. If you ever mess up or delete your sample dashboard, you can come back later and create a fresh one whenever you want.
#mongodb