This personal project has been a long time coming. If I have to choose three things that I am passionate about, they would definitely be: food, statistics, and TV shows — in no particular order. To maximize my utility, I’ve been putting food and the TV together for the longest time. If you picked a moment at random in my life, there is a high probability I would have been eating and watching the telly.
I had an idea to put another two of my favorite things together — statistics and TV shows, but there was too much good content on the combined prowess of Netflix, Hulu, and Prime for me to step away. With the quarantine, all plans for the summer was scrapped and I finally got around to doing it.
How I Procured My Data
Netflix has a functionality that isn’t commonly heard of but extremely useful. It allows you to download all of your viewing history as a “csv” file. Overall, my Netflix persistence paid off with roughly 1000 data points over the past 3 years. That’s almost a show a day. And we haven’t even included my Hulu, Prime, and CBS accounts yet.

One limitation of the data is that Netflix overwrites your viewing history with the latest date of viewing. For example, Since I watched Knock Down The House (Shoutout to AOC there) twice, it would only report the second time I watched it and not the first. However, since I have hopped from one friend’s account to the next over the past three years (my cheap self tried never to mooch off someone for too long), I was able to capture some of the re-watching that provides more color to my analyses. This quirk would result in some bias against shows that are rewatched immediately vis-a-vis shows that are rewatched after some time. However, since the former is a much rarer behavioral pattern for me than the latter, this bias isn’t a game-changer.
After procuring my viewing activity, I wanted to get a rich set of variables such as episode length, number of seasons and episodes, genres, tags, and actors. I was able to scrape the IMDb website for this information, as you can see from the red boxes below.
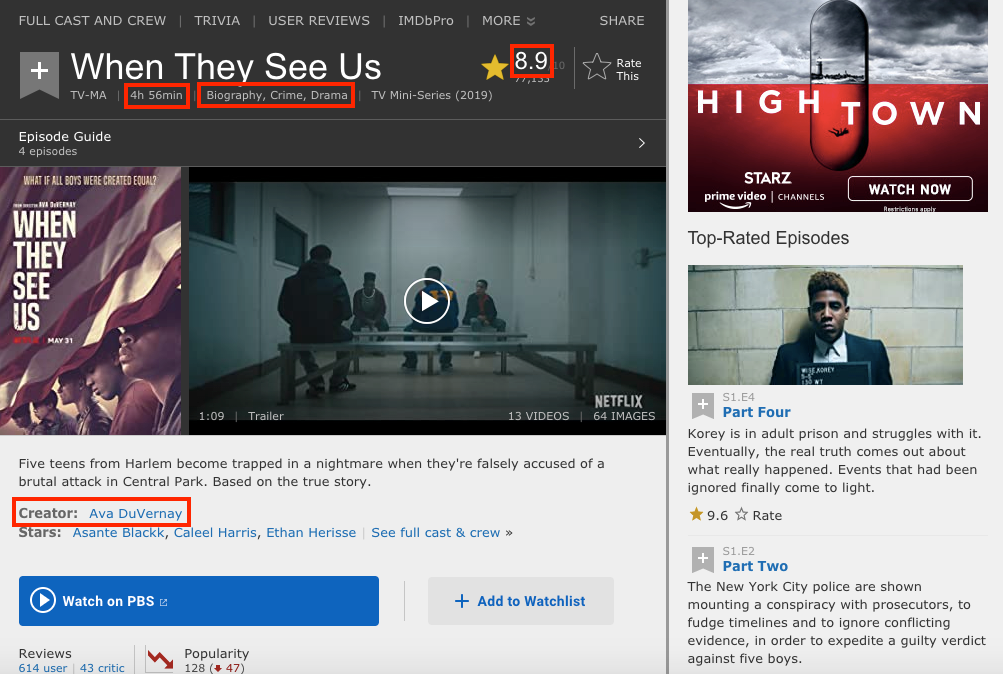
I definitely got more information than I needed for this first part of the analyses, but all that information in escrow is going to come in handy someday.
Measuring “Retention Rate”
The first metric I wanted to investigate for each TV show was how willing I was to finish the show after starting on it. To determine this, I created a simple metric called “Retention Rate” which is the total time spent on a TV show (Number of episodes watched * Total episode length as a proxy for total time spent on an episode) divided by the total show length (Number of seasons * Number of episodes * Total episode length).
Why is this even important? First off, it is if you are like me — looking for something long term. There is nothing more antagonizing (there actually probably is) than browsing Netflix during dinner time and going through all of the “recommendations” before realizing that you’ve inadvertently finished your dinner and you’ve got to get back to work.
#statistics #data #python #netflix #tv-shows #data analysis
