In this series of articles, I will be sharing a short summary of the book Storytelling with Data by Nussbaumer Knaflic. All of the content is taken from her book but I have tried to summarise the content by explaining the six important lessons taught in the book regarding the subject matter. I hope these six lessons would go a long way in improving your visualization expertise and hence in the art of better storytelling from Data.This would be a series of articles ,in each article I would be summarising one or two lessons. In this part, I will be summarising the first two key lessons.

Image-0-Courtesy of Storytelling with Data by Nussbaumer Knaflic
1.Understand the context
Nussbaumer explains how it is fundamental for you to understand the context for which you are going to use the data and generate value. Her tip is to ask three important questions to understand the context and then using this context to adapt your generated visualization.
a)Who?
She mentions repeatedly throughout the book that we must understand the audience for your visualisation. This way you will be able to adapt your visualisation according to the needs of your audience and avoid general graphs. Moreover, the needs of the audience allow us to be specific in using our data and hence generate better value.
b) What?
Firstly, you understand the underlying action that you want your audience to take by appreciating what do you need your audience to know or do? Afterwards, you ask what is the mechanism that you are going to use to communicate with your audience. Filtering out the most effective medium of communication to interact with your audience. The below illustration is quite effective to further elaborate the mentioned point:
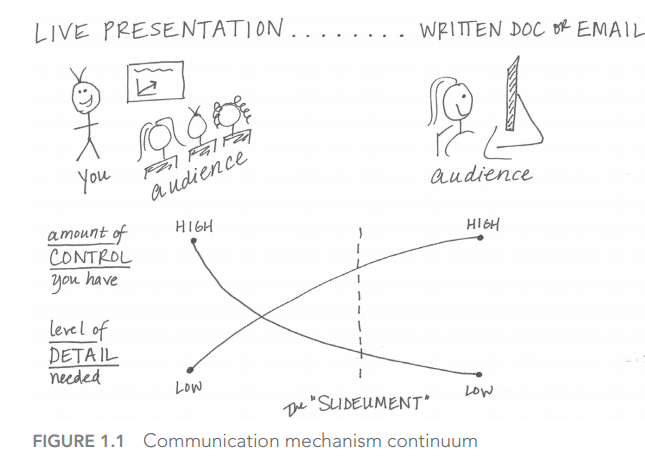
Image 1-Courtesy of Storytelling with Data by Nussbaumer Knaflic
Finally, you ask yourself as ‘what tone do you want your communication to set?’[1]
c) How?
Finally, this is the last question that you ask which is like the innermost layer of the series of questions you ask. You** understand as what data will I need to use** to elaborate my principle point which has been polished by asking the questions ‘What’ and ‘Who’.
Just to summarise, Nussbaumer Knaflic has given the following example to reflect the importance of understanding the context by asking the three mentioned questions:
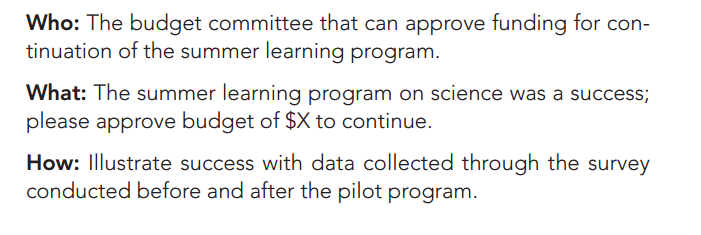
Image 2-Courtesy of Storytelling with Data by Nussbaumer Knaflic
Finally, she talks about the principle of **3-minute Story **and Big Idea. According to her, it is imperative you can summarise complete content that you would like to communicate in a 3-minute story which according to her is, ‘if you had only three minutes to tell your audience what they need to know, what would you say?’[1]. Moreover, the Big Idea is the main principle around which you are revolving around when utilizing the data to generate value for your audience. The idea of Big Idea is summarized well in the following illustration:
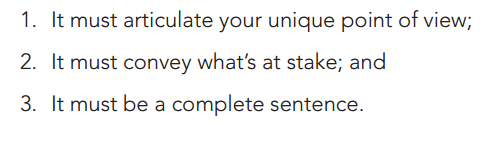
Image 3-Courtesy of Storytelling with Data by Nussbaumer Knaflic
Therefore, the first lesson is to understand the context and then embarking on your journey of utilizing the data as per the understood context.
#storytelling #data #data-science #data-analysis #data analysis