Every single time series (TS) data is loaded with information; and time series analysis (TSA) is the process of unpacking all of that. However, to unlock this potential, data needs to be prepared and formatted appropriately before putting it through the analytics pipeline.
TS may look like a simple data object and easy to deal with, but the reality is that for someone new it can be a daunting task just to prepare the dataset before the actual fun stuff can begin.
So in this article we will talk about some simple tips and tricks for getting the analysis-ready data to potentially save many hours of one’s productive time.
Finding data
If you are doing the analysis with your own dataset, you have it. But folks who are just learning TSA, finding the right dataset can be burdensome.
There are actually quite a few data sources. Some datasets — toy data as they are known— that came with machine learning libraries have been around for a long time. These “toy” data are great to play with, especially for beginners. But it’s an addiction that everyone needs to get past ASAP and dive into the real world.
Below are some sources to find data on a range of topics in different domains — some are curated and some require cleanups. You should definitely find your favorite one from this list.
I recommend that you start with curated datasets so you don’t have to pull your hair to fix problems with data and lose interest in the real fun stuff. But once you learn the fundamentals, find data as messy as possible, it will force you to go through the entire analytical pipeline.
Okay, so here are some toy datasets — clean, curated and analysis-ready — frequently used in machine learning tutorials:
- Number of traveling air passengers reported for each month between 1949 and 1960
- Hourly electric energy consumption by customers in certain US states
- Stock market data with opening, high, low and closing prices along with transaction volume for different companies
- A super small dataset on shampoo sales
- Daily minimum temperature data between 1981 to 1990 (I don’t know which country/city is represented, but that doesn’t matter)
- Daily recorded air quality data (CO, SO2, O3 etc.) for different cities in India
For real-world datasets, there are some really great repositories. I honestly think you don’t need to go beyond these repositories to learn advanced TS analytics and modeling.
1 ) The US Census Bureau has a large selection of time series data on a wide range of US business activities
2 ) Federal Reserve Economic Data (FRED) is a great data source on the US economic indicators
3 ) World Development Indicators (WDI) is a huge repository on social, economic and environmental issues of countries around the world, maintained by the World Bank.
Data preparation
For starters, there’s always a temptation to treat time series just like any other dataset. And then jump the gun. But TS observations are different from cross-sectional observations we are familiar with.
Time series data have been around for a long time and many people devoted their lives to make other peoples’ lives easier (Rob Hyndman in R programming language and Jason Brownlee in Python world came to mind).
There are quite a few wonderful libraries specifically designed to deal with TS data. Through transforming data you let the library recognize that it as a special TS object.
Assuming that you have done the required pre-processing — e.g. renaming columns, taking care of missing values etc. — here is how you’d prepare data in a few steps.
For this exercise I’m using a toy data over-used in machine learning — air passenger dataset — and executing codes in Python.
# import a couple of libraries
import pandas as pd
import numpy as np

# import data
df = pd.read_csv("../DataFolder/file.csv")
# look at the head
df.head()
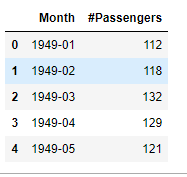
First few rows of the dataset
All we can see from the first few rows is that the dataset has two columns, the first representing a date column in ‘yyyy — mm’ format and a value column with actual observations.
Remember, we don’t know yet if it is a time series object, all we know is it’s a dataframe with two columns.
#programming #machine-learning #data-science #time-series-analysis #business-intelligence #data analysis