Introduction
There are many data visualization libraries in Python, yet Matplotlib is the most popular library out of all of them. Matplotlib’s popularity is due to its reliability and utility - it’s able to create both simple and complex plots with little code. You can also customize the plots in a variety of ways.
In this tutorial, we’ll cover how to plot Violin Plots in Matplotlib.
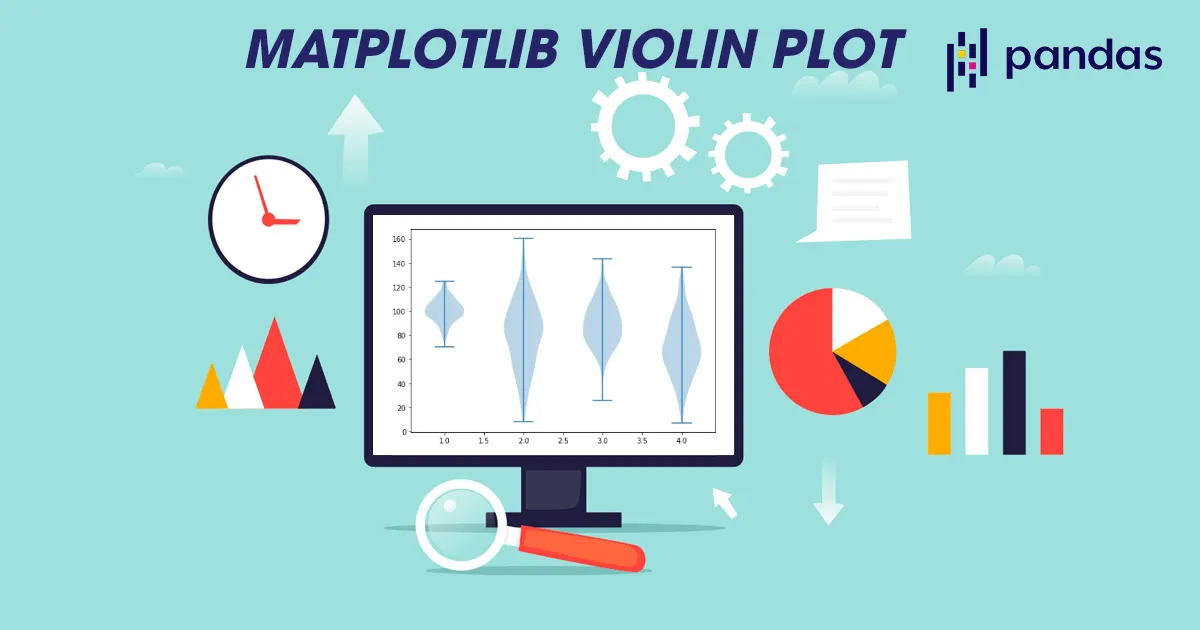
Violin plots are used to visualize data distributions, displaying the range, median, and distribution of the data.
Violin plots show the same summary statistics as box plots, but they also include Kernel Density Estimations that represent the shape/distribution of the data.#### Introduction
There are many data visualization libraries in Python, yet Matplotlib is the most popular library out of all of them. Matplotlib’s popularity is due to its reliability and utility - it’s able to create both simple and complex plots with little code. You can also customize the plots in a variety of ways.
In this tutorial, we’ll cover how to plot Violin Plots in Matplotlib.
Violin plots are used to visualize data distributions, displaying the range, median, and distribution of the data.
Violin plots show the same summary statistics as box plots, but they also include Kernel Density Estimations that represent the shape/distribution of the data.
#python #matplotlib #pandas #data science #data visualization
