The article demonstrates the intertemporal approach that extends and generalizes the scope of the rolling time series technique for deriving models of transition processes and empirical strategies. The approach is illustrated within the context of explaining the momentum premium, a long-term ongoing challenge.
The momentum effect was documented in 1993 by Jegadeesh and Titman [1] shown generating abnormal positive returns from 1965 to 1989 for US common stocks. Since then the conventional cross-sectional momentum strategy has been epitomized as ranking assets by past one year returns lagged one month and going long a subset of past winners assets while shorting a subset of past losers. The existence of momentum across a wide spectrum of asset classes, markets, and time horizons as identified by multiple papers has cumulated in the view the factor is almost omnipresent. However, the source of the momentum premium remains an open question with no single model dominating the narrative. A number of risk-based and behavioral models have been presented to explain this phenomenon with one noteworthy discussion on the topic between Clifford Asness and Eugene Fama [2].
Recently, the momentum effect was addressed with the rolling intertemporal analysis proposed in the Uncovering Momentum paper [3]. Within this approach, the selected deciles are rolled forward across the time horizon while simultaneously their portfolio returns are collected across each month during the combined 11-month ranking, 1-month lagged, and holding intervals relative to the portfolio formation date. Analogous with rolling window forecasting, the ranking period can be associated with the in-sample interval while the holding period constitutes the out-of-sample. Below is the figure from the Uncovering Momentum paper presenting the results from running the rolling intertemporal approach on the top momentum decile for the bull market states over August 2006 to August 2017.
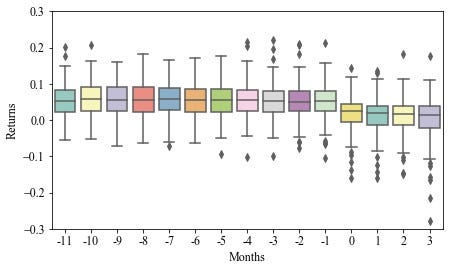
The boxplots highlight the bump between the in- and out-of-sample intervals. Previous research studies were primarily dedicated to analyzing the holding period. These plots switch our attention to the transition process. The left side of this bump can be explained by a random sampling model. According to this model, the momentum effect (in the out-of-sample) however should be zero and hence defines a criterion for assessing the underlying momentum theories and models. This article extends the intertemporal approach by explaining the momentum effect as a portfolio of strongly performing stocks. The implementation is based on the Quantopian platform and includes three steps: running the Quantopian pipeline, selecting the features, and rolling the intertemporal approach.
#timeseries #data analysis