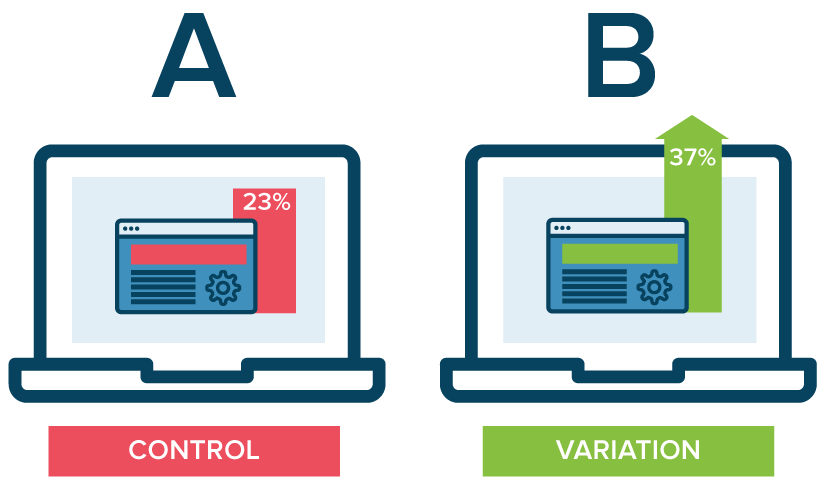
A/B tests are ubiquitous today as a tool for designing just about anything. They are often looked to as a more objective way of answering the age-old question of, “which is better?” by quantifiably measuring success. In my eyes, the process of conducting an A/B test has always epitomized the “science” in data science. It shares many elements with randomized controlled trials (RCTs), which are not only the gold standard of clinical trials, but also psychology laboratory experiments, by creating a setup designed to isolate and measure the effect of changing what one group sees vs. another.
However, the question of sample size (i.e. “how many people do I need to test on?”) is frequently asked, as testing takes time, and time is money. Ideally, as soon as you have a confident answer to your question, you can choose the winner and stop using the inferior version. By using a power analysis to determine sample size, you can get a better sense up front about how long a test will need to run before it can confidently confirm or refute your hypothesis.
What is a power analysis?
In order to determine the minimum sample size required for running a statistically robust test, an a priori power analysis can be done. A priori refers to the fact that the analysis is occurring before collecting results. A power analysis considers the relationship between 4 parameters:
- effect size (e.g. Cohen’s d or h): a standardized way of calculating the magnitude of an effect observed in an experiment; the exact statistic depends on what is being compared and the hypothesis test being used: for differences between two means, Cohen’s _d _is frequently used, while Cohen’s h is specifically for differences between two proportions
- sample size (n): number of observations or people used in a study or experiment
- significance level (⍺, often calculated as a p-value): commonly thought of as a threshold that must be met to deem the results legitimate; this number actually means is that if a test is repeated infinite times and there is no real effect, the results observed would still happen by chance ⍺% of the time (also known as a Type I error, or false positive)
- power (1-_β): t_he probability of being right when you do determine that there is a significant difference in the results; _β _refers to the chance of getting a false negative (or Type II error), where you’re saying there’s no effect when there is in fact one, so power is expressed as 1-β

Any of these parameters can be solved for if given the other 3; terminologically speaking, a priori implies that this analysis is done before an experiment is run in order to calculate required sample size from the other 3.
There are a number of libraries and freeware that support functions for power analysis, which I have linked to at the end of this article; for this article, I will be using Stephane Champely’s R package pwr.
A practical step-by-step methodology for estimating sample size
Before diving into an example in the next section, here’s an outline of the general procedure you can apply to a wide variety of A/B testing use cases:
- Contextualize the intervention/treatment and come up with an initial hypothesis; determine whether the experiment is one- or two-sided*
- Set clear desired benchmarks for power and significance level (0.80 and 0.05 are considered defaults, respectively)
- Estimate effect size based on prior data, results, research, etc.
- For proportions, can consult Cohen’s h; else, Cohen’s d
- Can start with current/historical baseline conversion rates/averages in most cases as a reference point; otherwise, a pilot test could suffice
- Calculate sample size using a priori power analysis.
- (Optional) Depending on the stakeholder, it may be useful to project the time required to reach sample size (e.g. if testing on users visiting a web page)
- Run test with 50–50 split until sample size reached and evaluate
- Evaluate results by running the appropriate hypothesis test
- If not significant, the effect size may be smaller than originally expected, so a larger sample size would be needed to validate it
- If sample size not reached, but evaluation desired, significance will likely only be found if the effect size is bigger than originally
- If more data is wanted, continue to run test with a more lopsided split and monitor results in accordance with business metrics until sufficiently confident
#a-b-testing #data-science #design-thinking #hypothesis-testing #power-analysis #testing
