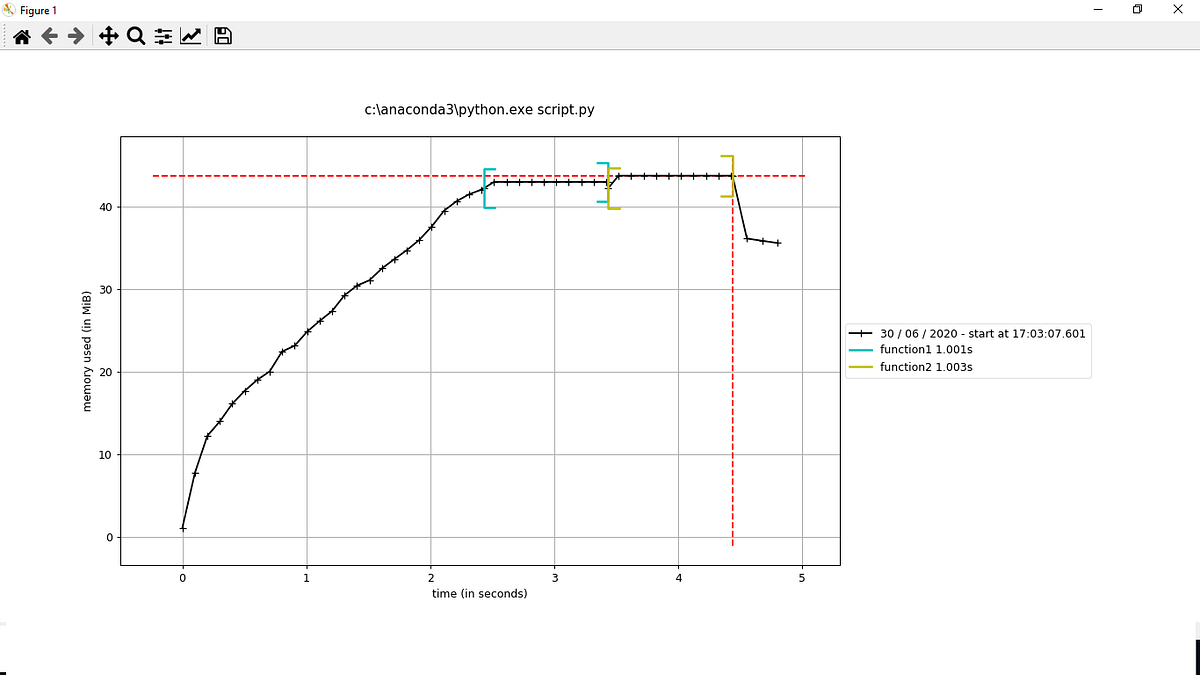
Python developers should be aware about the memory consumption of the code they are writing.This will help in multiple ways.Be it deciding hardware or deciding need of optimization or finding memory leak etc.
We’ll discuss a very simple yet very useful python library memory_profiler.
pip install memory_profiler

#Load its magic function
%load_ext memory_profiler
from memory_profiler import profile
We can imagine using memory profiler in following ways:
1.Find memory consumption of a line
2.Find memory consumption of a function
3.Find memory consumption of a function line by line
4.Find memory consumption of complete python script
Now.let’s discuss all these scenarios
- Find memory consumption of a line
Just add magic function %memit at the start of line
%memit x = 10+5
#Output
peak memory: 54.01 MiB, increment: 0.27 MiB
Here,peak memory is memory consumed by the process running this code.Increment is nothing but memory required/consumed due to addition of this line of code.This same logic applies to below options as well.
2. Find memory consumption of a function
Add magic function at the start of line from where function is called.
def addition():
    a = [1] * (10 ** 1)
    b = [2] * (3 * 10 ** 2)
    sum = a+b
    return sum
%memit addition()
#Output
peak memory: 36.36 MiB, increment: 0.01 MiB
3. Find memory consumption of a function line by line
For a line-by-line description of memory use, we can use the @profile decorator. Unfortunately, this works only for functions defined in separate modules rather than the notebook itself, so we’ll start by using the %%file magic to create a simple module called demo.py, which contains our function
%%file demo.py
from memory_profiler import profile
@profile
def addition():
    a = [1] * (10 ** 1)
    b = [2] * (3 * 10 ** 2)
    sum = a+b
    return sum
#memory-management #memory-improvement #python #code-quality #python-programming
