Reading images is super easy in python, as there are many libraries available for reading, editing, and visualizing different formats of images. Examples of these libraries are Matplotlib, OpenCV, Pillow, etc. These libraries work perfectly well with popular image formats such as .png, .tiff, .jpg, .jpeg, etc. but they don’t seem to work for GeoTiff images.
The reason can be easily guessed if we understand how GeoTiff format is different from other image formats. A simple definition would be something given below.
A GeoTIFF is a standard
_.tif_or image file format that includes additional spatial (georeferencing) information embedded in the .tif file as tags.
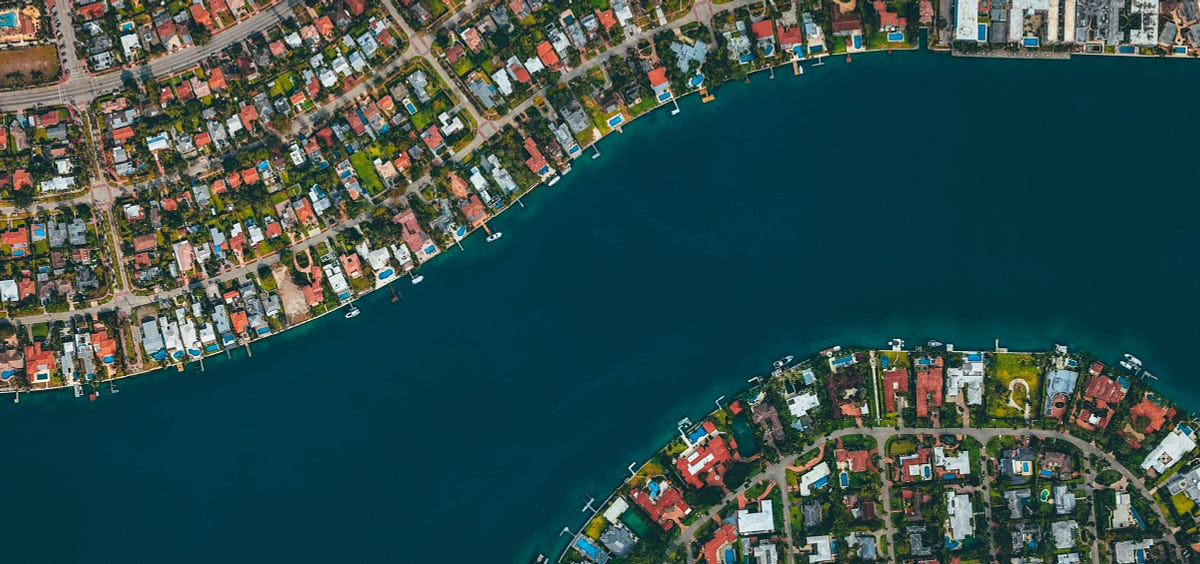
By tags, it is meant that it has some additional metadata like Spatial extent, CRS, Resolution, etc. along with the pixel values. It is a popular distribution format for satellite and aerial photography imagery.
This article discusses different ways of reading and visualizing these images with python using a jupyter notebook. The libraries used are GDAL, rasterio, georaster, and Matplotlib(for visualization). These libraries will help us in converting those images to simple numpy array format from there we can also perform other image transformations using numpy or TensorFlow although I have not discussed transformations in this article.
Installation steps are mentioned in the documentation of these libraries, I have provided their links in the references section, please go through them.
Using RasterIO
RasterIO is implemented by Mapbox and it provides python API for reading geo-referenced dataset. Also, the documentation mentions that unlike GDAL python bindings, it doesn’t suffer from dangling C pointer and other pointer issues that can crash your program.
import rasterio
from rasterio.plot import show

fp = r'GeoTiff_Image.tif'
img = rasterio.open(fp)
show(img)
#geographicdatascience #gis #python #data-visualization #data-science