Monitoring the growth of the SQL Database is one of the essential tasks of the SQL Server DBA. In this article, I am going to explain how we can monitor the growth of the SQL database using the default trace. First, let me explain the default trace in SQL Server.
Default Trace
SQL Server default trace was added as a feature in SQL Server 2005. It is a lightweight trace, and it contains five trace files. The default trace captures the following events:
Database events
It captures the following database events:
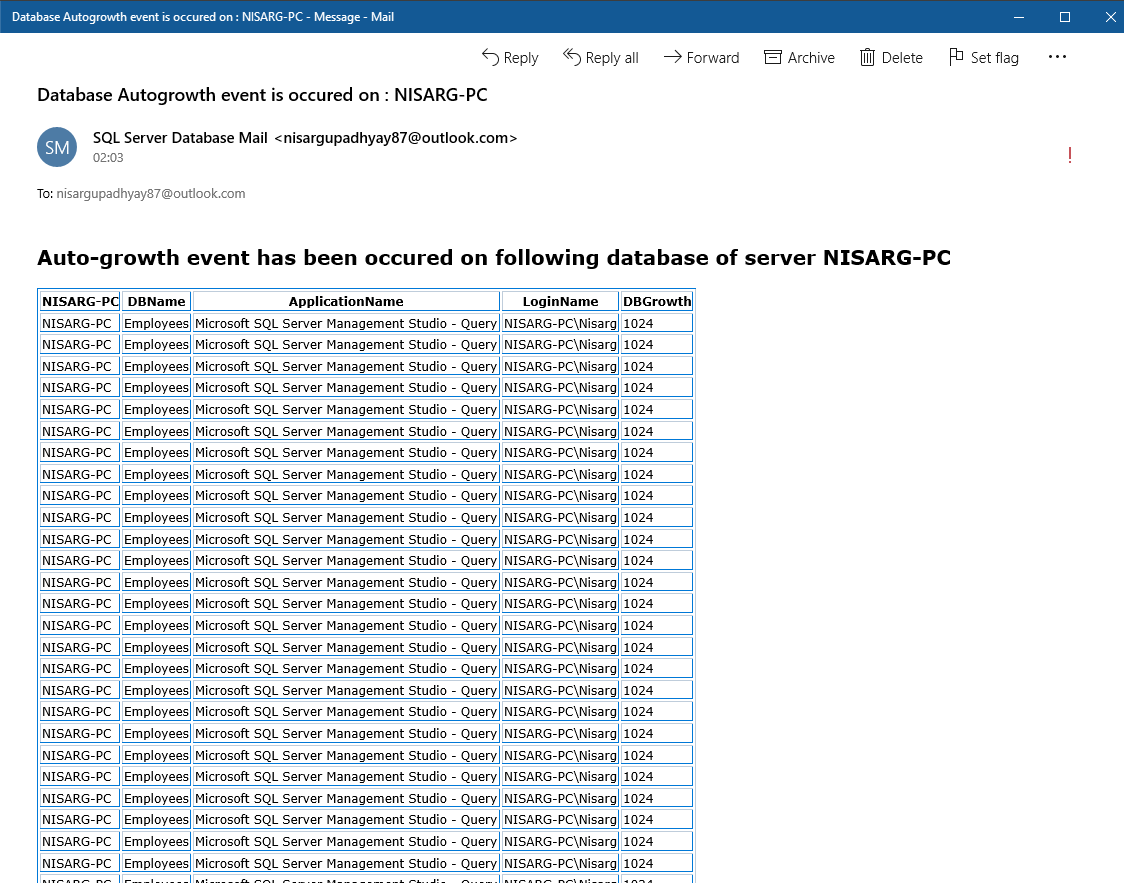
- Data file auto grow events
- Data file auto shrink events
- Logfile auto grow events
- Logfile auto shrink events
Object events
It captures the following object events:
- The object is created
- The object is deleted
- The object is altered
- An index is created, and statistics updates
- The database is deleted
Warnings and errors
It captures the following warnings and errors:
- The SQL Server error log
- The statistics are missing on the column
- The hash warning and sort warning
- The missing join predicates
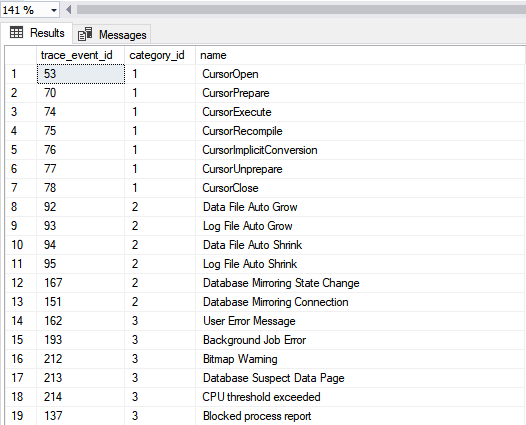
It also captures other SQL database events, and you can see the entire list by executing the following query:
select * from sys . trace_events order by category_id asc
The following is the output:
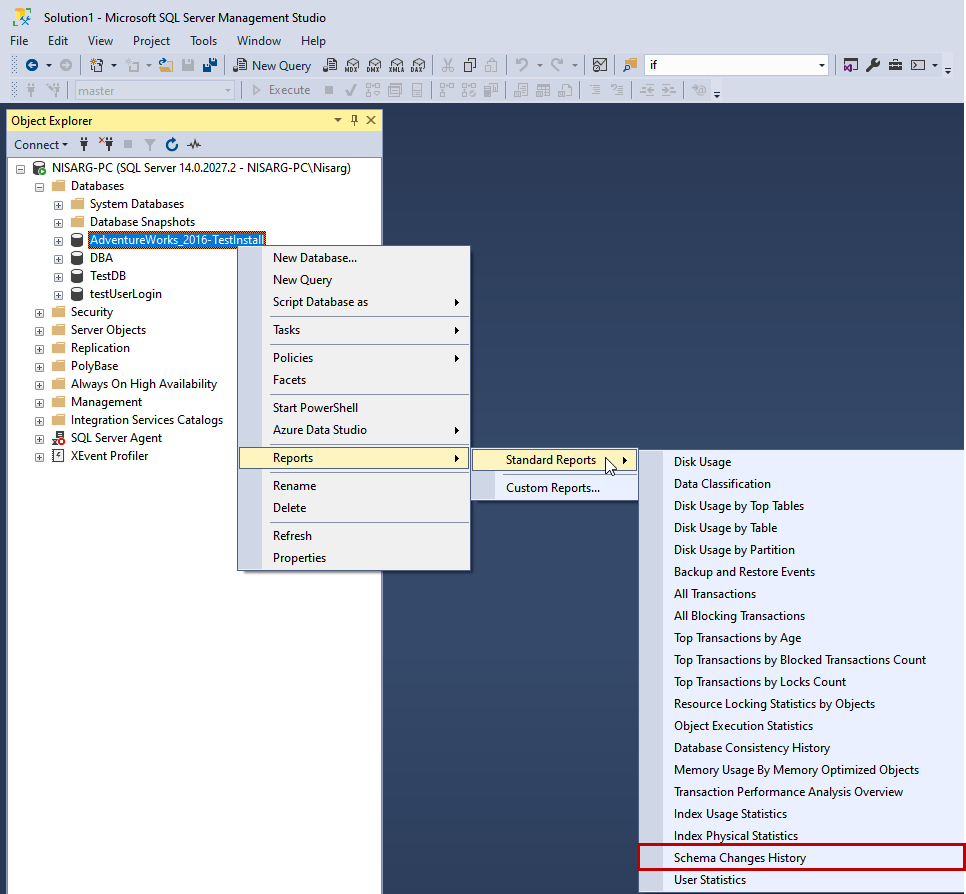
If the default trace is running, then you can view the schema change report from the SQL Server management studio (SSMS). To do that, launch SQL Server management studio -> connect to the database engine -> right-click on the desired database -> hover on **Reports **-> hover on **Standard Reports **-> select Schema Changes History“. See the following image:
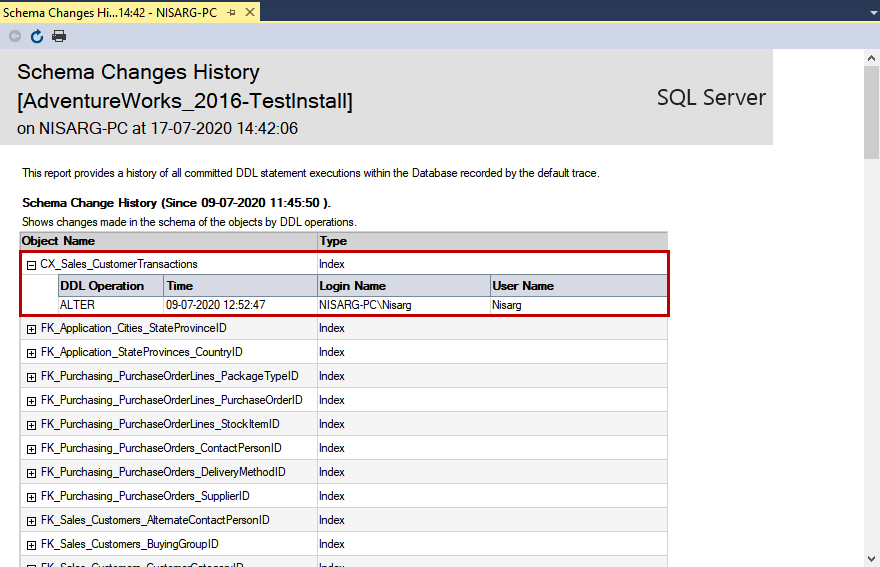
The report contains a list of objects that have been created, altered, or deleted. See the following image:
As mentioned, the default trace is lightweight, but if you want to disable it, you can do it by executing the following queries.
EXEC sp_configure ‘default trace enabled’ , 0 ;
GO
RECONFIGURE ;
GO
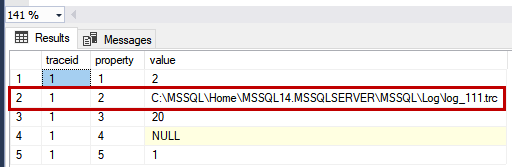
You can view the location of the trace (*.trc) file by executing the following query.
SELECT * FROM :: fn_trace_getinfo ( default )
The following is the output:
#jobs #maintenance #monitoring #database