Aggregate functions are one of the main building blocks in Power BI. Being used explicitly in measures, or implicitly defined by Power BI, there is no single Power BI report which doesn’t use some sort of aggregate functions.
What are the aggregate functions?
Aggregating means combining values in your data performing some mathematical operation. That can be SUM, AVERAGE, MAXIMUM, MINIMUM, COUNT, COUNT DISTINCT, MEAN, STANDARD DEVIATION, etc.
However, in-depth observation of aggregate functions is not in the scope of this article. Here, I wanted to demonstrate how you can use aggregate functions in an unconventional way, since I believe it can be useful in some specific scenarios.
Default behavior of aggregate functions
By default, aggregations are being calculated on columns. Let’s take a look at following basic example:
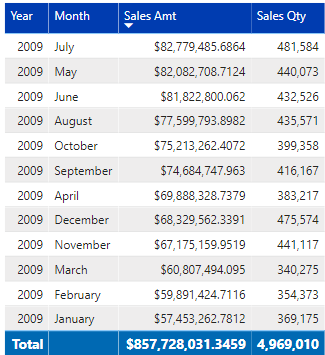
This is a typical example of SUM aggregate function. Numbers are being aggregated on Year and Month level, and finally, in the end, we can see the total of individual values in the table.
We could also perform AVERAGE to find average values, MIN or MAX to find the minimum and maximum values, etc. Pretty straightforward and probably already known for most of the people who ever worked with Power BI or Excel.
#data-science #data #data-modeling #power-bi #towards-data-science #data analysis