If you have created a project for an Electron application using the Vue CLI, it is not possible to debug the application with Visual Studio Code (e.g. with breakpoints) right out of the box.
This article builds on the article Create an Electron application with Vue and Vuetify. Please read the article first if you have never set up a project for an Electron application with Vue CLI before.
We can build the application for any platform (Windows, MacOS or Linux) with the following command:
npm run electron:build
After the command has finished, we will have an executable Electron application in the subfolder dist_electron/.
Also we can run the following command:
npm run electron:serve
This command will run the Electron application as a development server and we can debug it directly in the Electron application using the built-in developer tools.
This will work for most of the time, but in the long run an application grows, functions and processes become more complicated. In the end, output on the console will no longer suffice.
But for illustration we will prepare a simple example with an output to the console and afterwards debug it with the Visual Studio Code.
Debug with console.log(…)
This is one of the most common techniques and in most cases I can only advise against it. For a quick test, you can write some output to the console, but the danger is that you will forget to remove the output when you don’t need it anymore.
We modify the HelloWorld component (HelloWorld.vue ) a little bit. First we add a simple function to open a URL in a new window. Additionally we write the URL to the console.

In the template section we update one of the v-for loops by using a click event instead of a href, which should call our method with the corresponding URL.
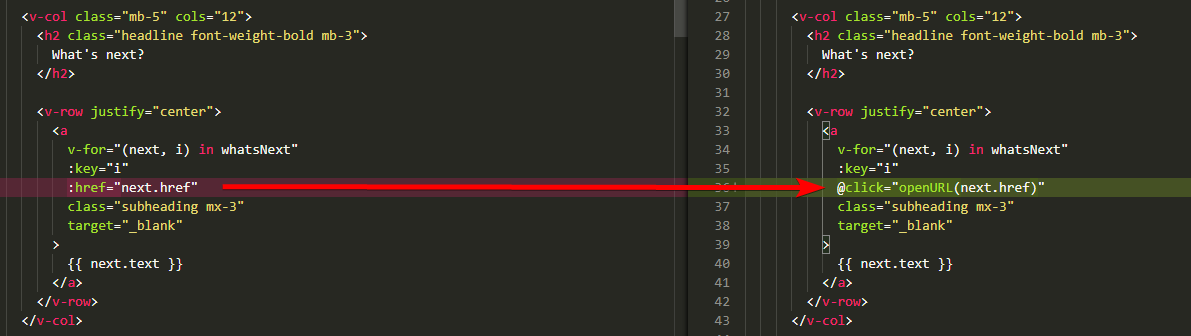
change href to click-event
#typescript #nodejs #vuejs #vscode #debugging
