What skills are required from an analyst when building a data-driven system?
Managing a business by KPIs, making decisions based on operational data and forecasts, finding business insights with the help of artificial intelligence is a dream every manager and business owner has. However, building such a system is not easy — there’s an entire zoo of IT services, and each requires support. In the end, everything comes down to people, those data analysts who know how to ‘communicate with machines’ and translate the results of their work into the language of business.
The process of turning big data into business solutions, an information product, consists of several stages and requires the teamwork of different people. There is even such a term —_ a Data-Driven Organization._ It is a company where management makes decisions based on analytics, not just experience, opinion, or intuition.
In order to become such a company, it is not enough to simply hire a team of top-notch programmers or buy an advanced CRM-system, you need to change the culture of corporate communications, understand the psychology of the participants of these processes.
An analyst is not necessarily a position, it is a role, above all: many employees participate in the preparation of management reports. But oftentimes customers and managers receive numerous tables and slides from their analysts, rather than information appropriate for decision-making.
In my 10 years of integrating corporate reporting systems I have observed many cases of expectations that the reality didn’t live up to, and described them in this article. This will help you understand where your company has flaws in communication and how to remove barriers on your way to Data-Driven culture.
3 Types of Analysts
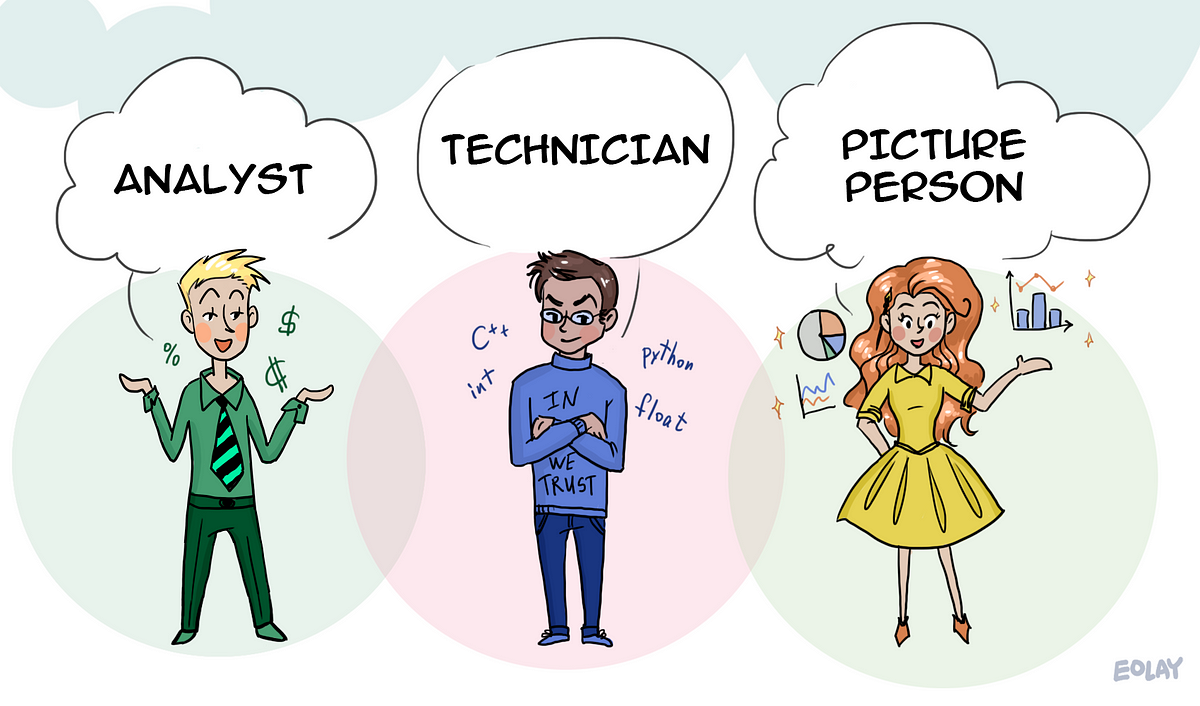
Staff working with data and reports can be divided into 3 groups: analysts, picture people, and technicians. They have different roles, tasks, and requirements for data, their processing, and results. They all do joint work using different approaches. This is where the paradoxes of their attitude to work arise.
- Analysts are finance specialists, economists, marketing specialists that look for answers to specific questions. For this purpose, they conduct research, collect information, and draw conclusions. Their task is to analyze data, identify cause-and-effect relationships, and study the impact of various factors on business processes. For example, an economist identifies the factors that influenced the growth of costs, and a web analyst builds the semantic core of the site out of search queries keywords.
- Technicians are database developers, mathematicians, and Data Science specialists. They derive information processing algorithms, design data warehouses, and automate reports. It is important for them how the system works, what affects it, and how to make the process error-free and uninterrupted, that is, to create a perfect algorithm.
- **Picture people **make the final product, know how to turn tables into clear diagrams and slides or even dashboards. Usually, they don’t hold the position of a designer, but a manager who understands what the business needs and can set tasks for designers and developers. An analyst can also play the role of a visualizer, think in categories of usability and have a sense of beauty.
Each of them considers their part of the work to be the most important. Analysts think it is the process of finding answers to questions, picture people consider it to be the beauty and accessibility of presentation, technicians believe it is models and algorithms. And the result is paradoxes that are not obvious to the end customer.
#storytelling #data-visualization #skills #analysis #dashboard #data analysis