Exploratory Data Analysis is a process where we tend to analyze the dataset and summarize the main characteristics of the dataset often using visual methods. EDA is really important because if you are not familiar with the dataset you are working on, then you won’t be able to infer something from that data. However, EDA generally takes a lot of time.
But, what if I told you that python can automate the process of EDA with the help of some libraries? Won’t it make your work easier? So let’s start learning about Automated EDA.
In this article, we will work on Automating EDA using Sweetviz. It is a python library that generates beautiful, high-density visualizations to start your EDA. Let us explore Sweetviz in detail.
Installing Sweetviz
Like any other python library, we can install Sweetviz by using the pip install command given below.
pip install sweetviz
Analyzing Dataset
In this article, I have used an advertising dataset contains 4 attributes and 200 rows. First, we need to load the using pandas.
import pandas as  pd
df = pd.read_csv('Advertising.csv')

Advertising dataset.
Sweetviz has a function named Analyze() which analyzes the whole dataset and provides a detailed report with visualization.
Let’s Analyze our dataset using the command given below.
# importing sweetviz
import sweetviz as sv

#analyzing the dataset
advert_report = sv.analyze(df)
#display the report
advert_report.show_html('Advertising.html')
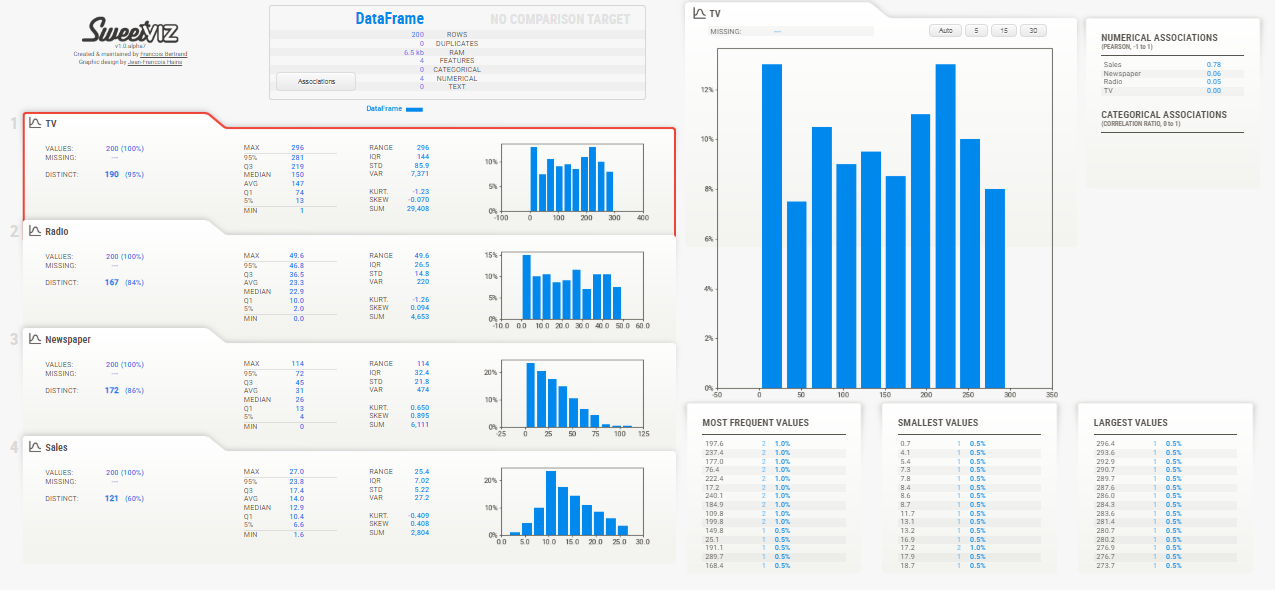
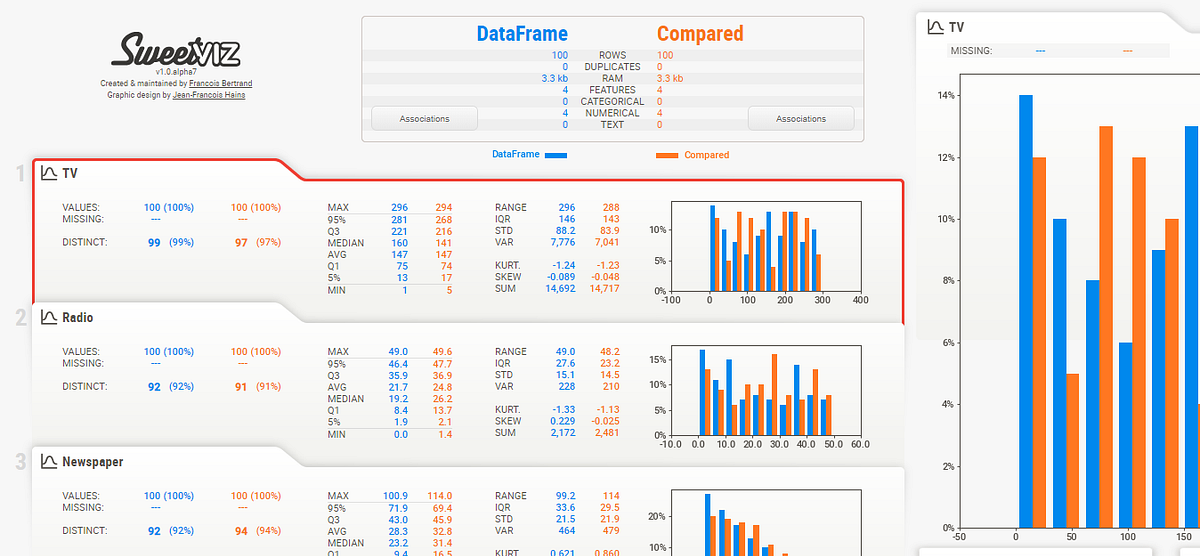
EDA Report
And here we go, as you can see above our EDA report is ready and contains a lot of information for all the attributes. It’s easy to understand and is prepared in just 3 lines of code.
#data-visualization #eda #data-analysis #python #data-science #data analysis