Pandas offers a wide range of DataFrame manipulations, but many of them are complex and may not seem approachable. This article will present 8 essential DataFrame manipulation methods which cover almost all of the manipulation functions a data scientist would need to know. Each method will include an explanation, visualization, code, and tricks to remember it.
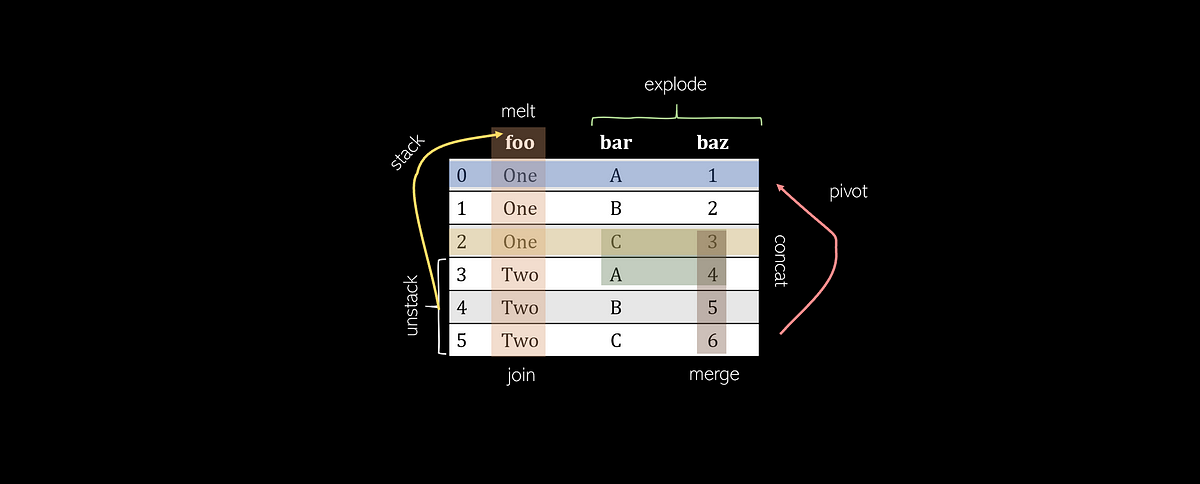
Pivot
Pivoting a table creates a new ‘pivoted table’ that projects existing columns in the data as elements of a new table, being the index, column, and the values. The columns in the initial DataFrame that will become the index and the columns are displayed as unique values, and combinations of these two columns will be displayed as the value. This means that pivots cannot handle duplicate values.
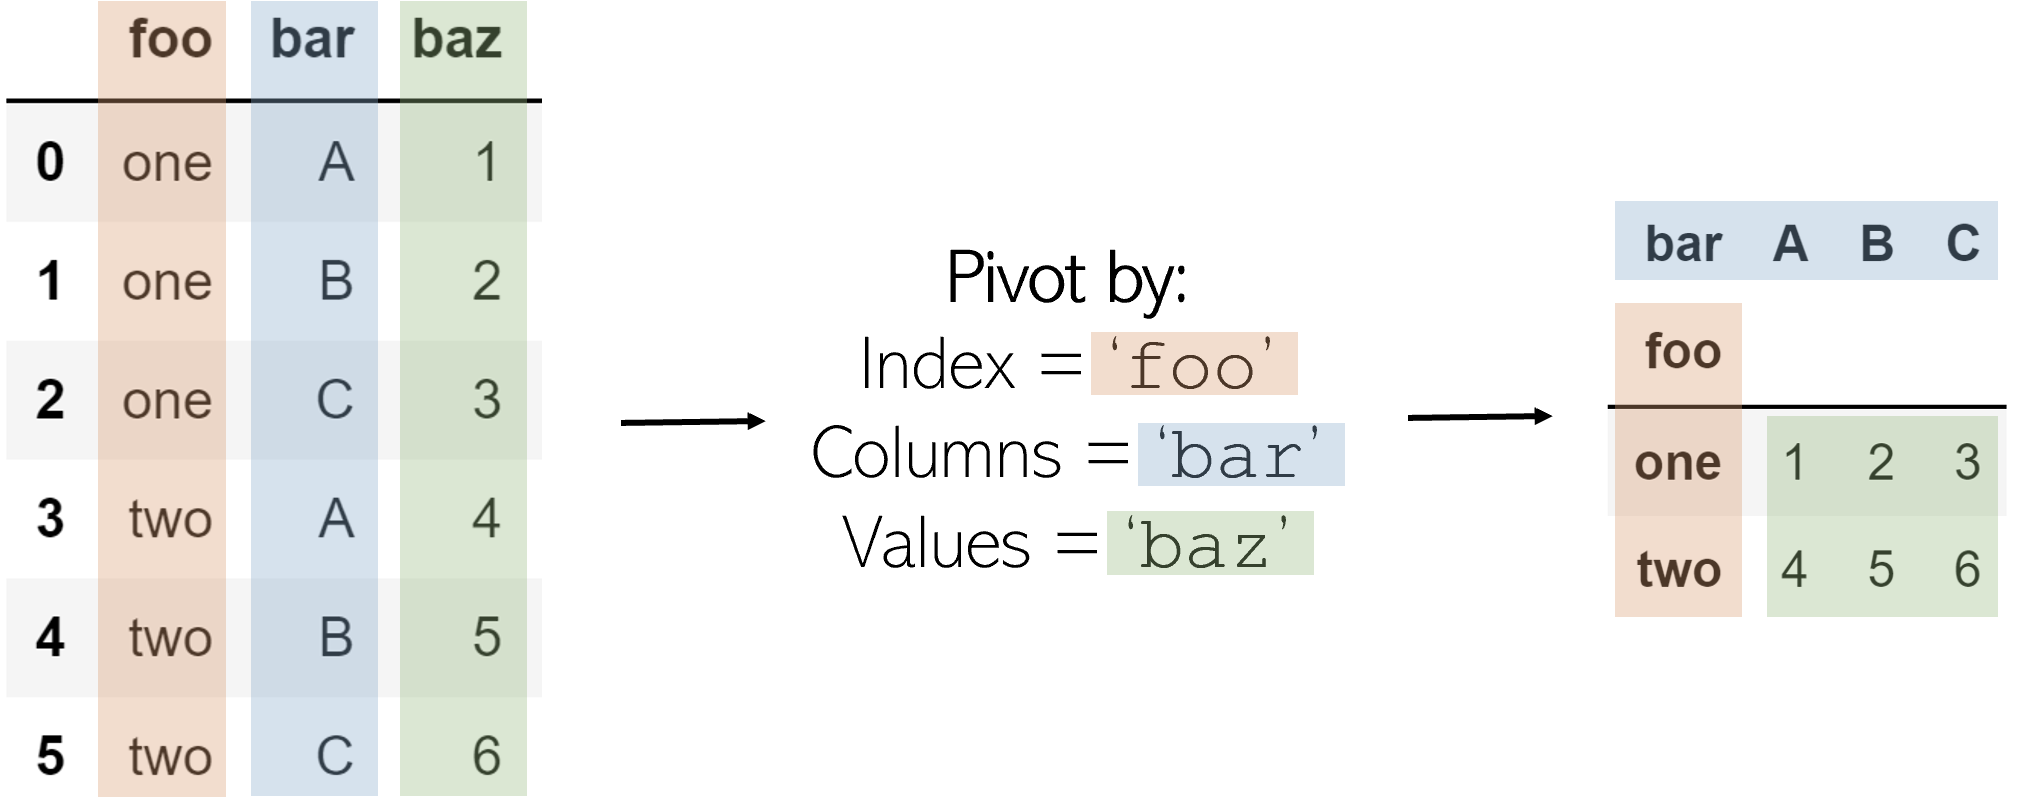
The code to pivot a DataFrame named df is as follows:
df.pivot(index='foo', columns='bar', values='baz')
To memorize: A pivot is — outside the realm of data manipulation — a turn around some sort of object. In sports, one can ‘pivot’ around their foot to spin: pivots in pandas are similar. The state of the original DataFrame are pivoted around central elements of a DataFrame into a new one. Some elements very literally pivot in that they are rotated or transformed(like column ‘bar’).
Melt
Melting can be thought of as an ‘unpivot’, in that it converts a matrix-based data (has two dimensions) into list-based data (columns represent values and rows indicate unique data points), whereas pivots do the opposite. Consider a two-dimensional matrix with one dimension ‘B’ and ‘C’ (column names), with the other dimension ‘a’, ‘b’, and ‘c’ (row indices).
We select an ID, one of the dimensions, and a column/columns to contain values. The column(s) that contain values are transformed into two columns: one for the variable (the name of the value column) and another for the value (the number contained in it).
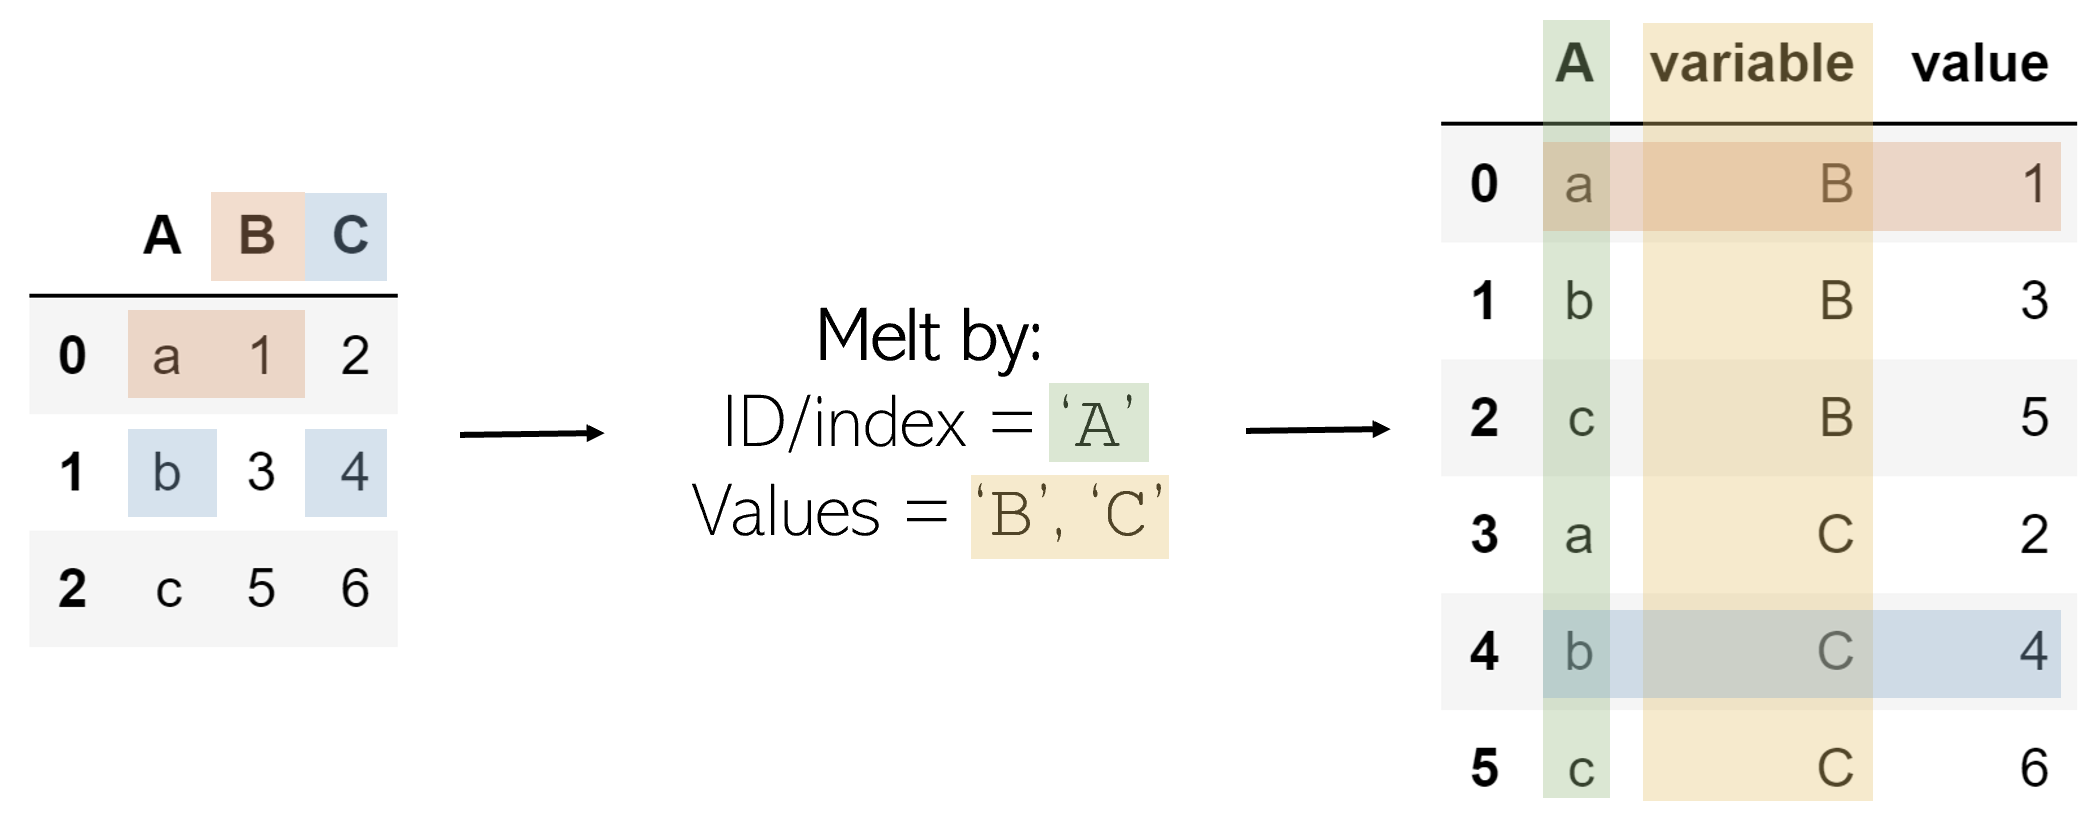
The result is every combination of the ID column’s values (a, b, c) and the value columns (B, C), with its corresponding value, organized in list format.
The melt operation can be performed like such on DataFrame df:
df.melt(id_vars=['A'], value_vars=['B','C'])
To memorize: Melting something like a candle is to turn a solidified and composite object into several much smaller, individual elements (wax droplets). Melting a two-dimensional DataFrame unpacks its solidified structure and records its pieces as individual entries in a list.
Explode
Exploding is a helpful method to get rid of lists in the data. When a column is exploded, all lists inside of it are listed as new rows under the same index (to prevent this, simply call .reset_index() afterwards). Non-list items like strings or numbers are not affected, and empty lists are NaN values (you can cleanse these using .dropna()).
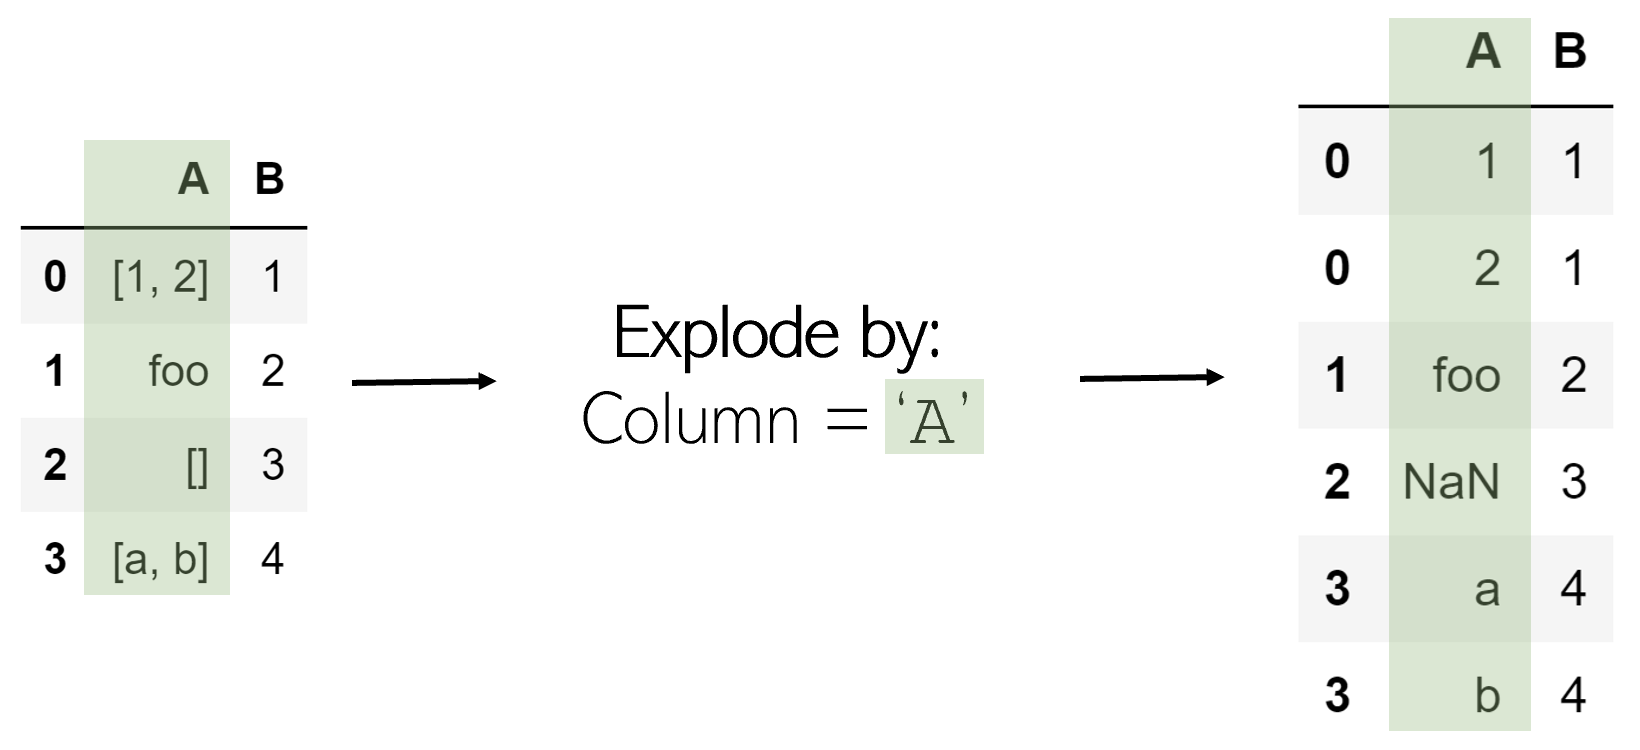
Exploding a column ‘A’ in DataFrame df is very simple:
df.explode(‘A’)
To remember: Exploding something releases all its internal contents — exploding a list separates its elements.
#computer-science #data-science #data #data-analysis #programming #data analysis