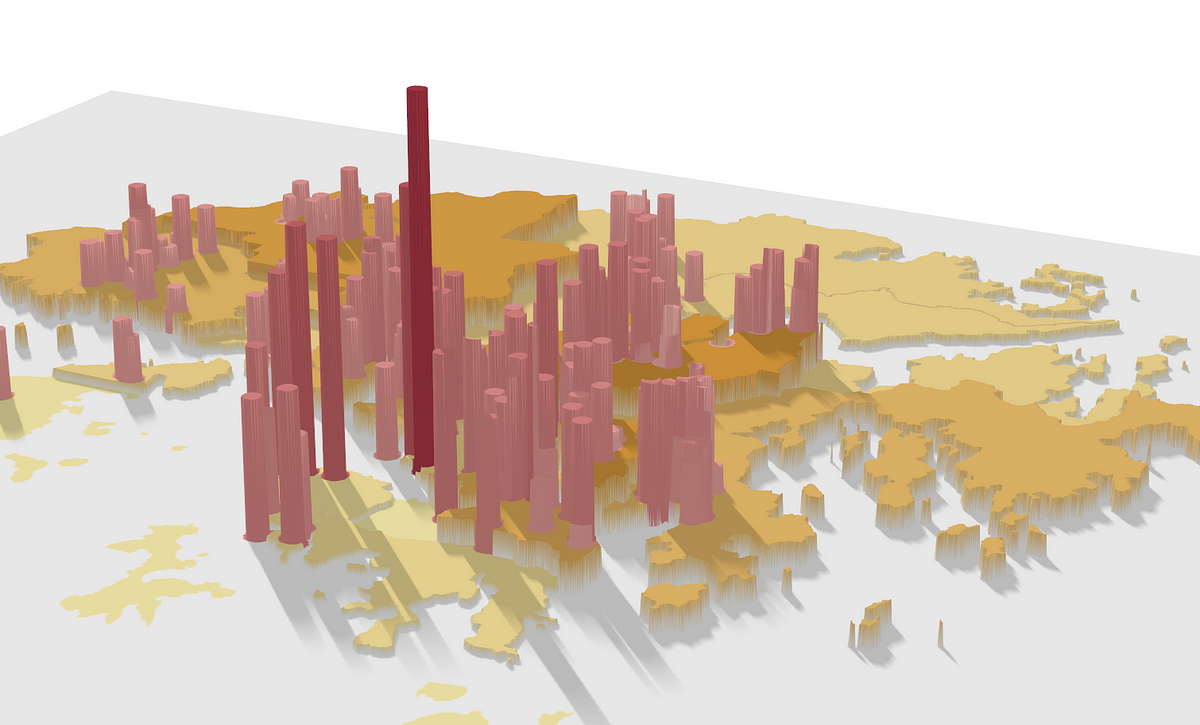
Rayshader is a powerful package in R supporting 2D and 3D data visualisation. What amazes me is its details of displaying the 3D plots and it provides lots of customisation. Most importantly, it allows you to directly transform the ggplot2 objects into 3D plot.
In this demonstration, the Hong Kong population and housing price data are used. Pre-processed data and the R scripts are uploaded to my Github page. Feel free to download and play around.
#data-science #data-visualization #maps #women-in-tech #education
2.60 GEEK