Azure Data Studio (ADS) is a popular cross-platform (Windows, Linux) tool for database professionals. It provides various useful features such as T-SQL editor, Visualizations, insights, Peek definitions, Notebooks, Git integration, extensions and more. Extensions add new functionality in the ADS. Microsoft provides several useful extensions. We have already covered few useful extensions in the Azure Data Studio category on SQLShack.
ADS also supports custom extensions. You can develop your extension and publish it in the community so that others can take benefit from it.
In this article, we will create a custom extension and deploy it in the Azure Data Studio.
Develop a custom extension in Azure Data Studio
ADS supports the dashboard at the server and database levels. To launch the server dashboard, connect to a SQL instance in ADS and Click on Manage. It shows the default server dashboard, as shown below.
Similarly, if you launch the dashboard from a specific database, it launches the database dashboard.
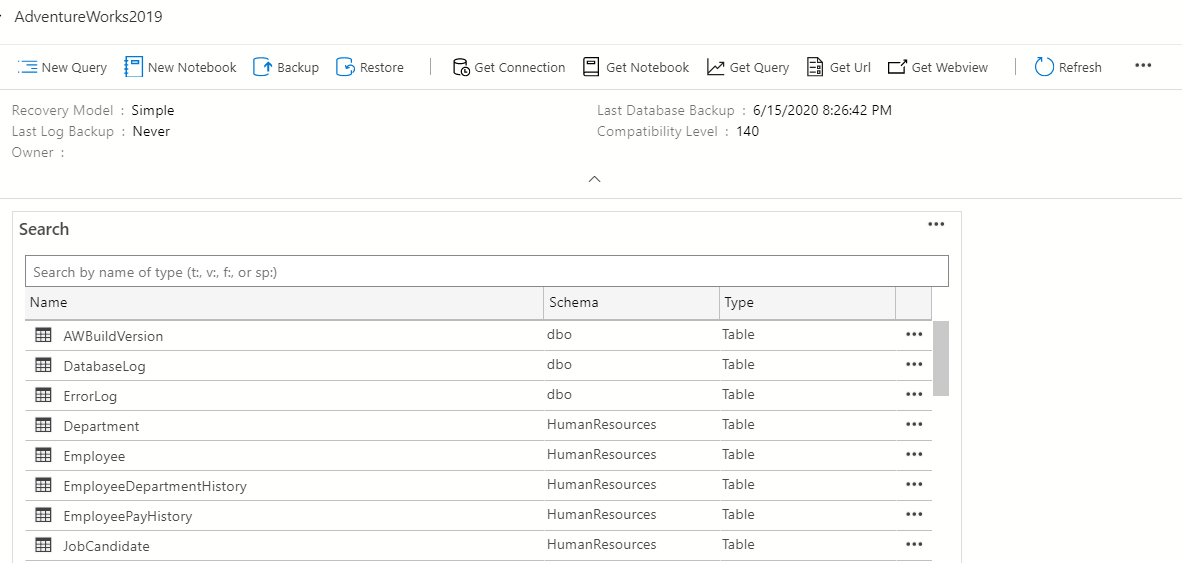
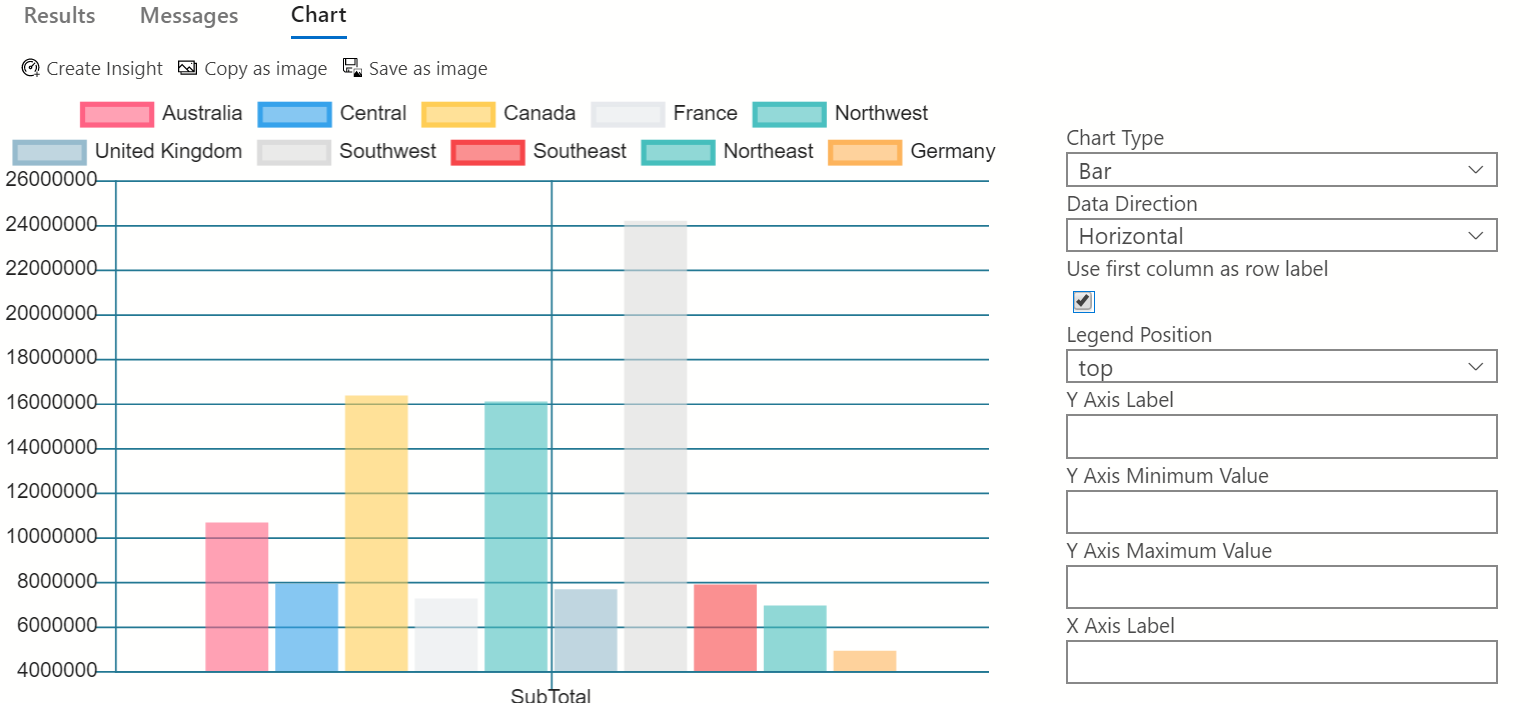
You can refer to the article Server and Database dashboards in Azure Data Studio for detailed knowledge. In this article, we will create a new database extension to execute a SQL query and return output in a chart format.
Prerequisites
For this article, we will require the following tools to develop an extension for ADS:
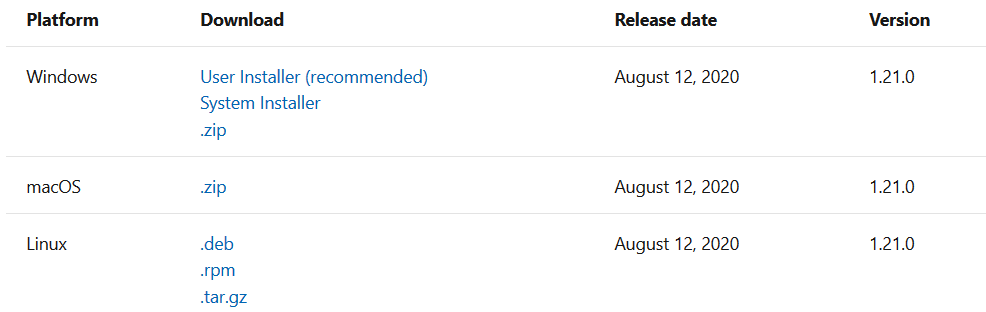
- **Azure Data Studio: **Install the latest version of the ADS. Currently, the latest version is 1.21.0
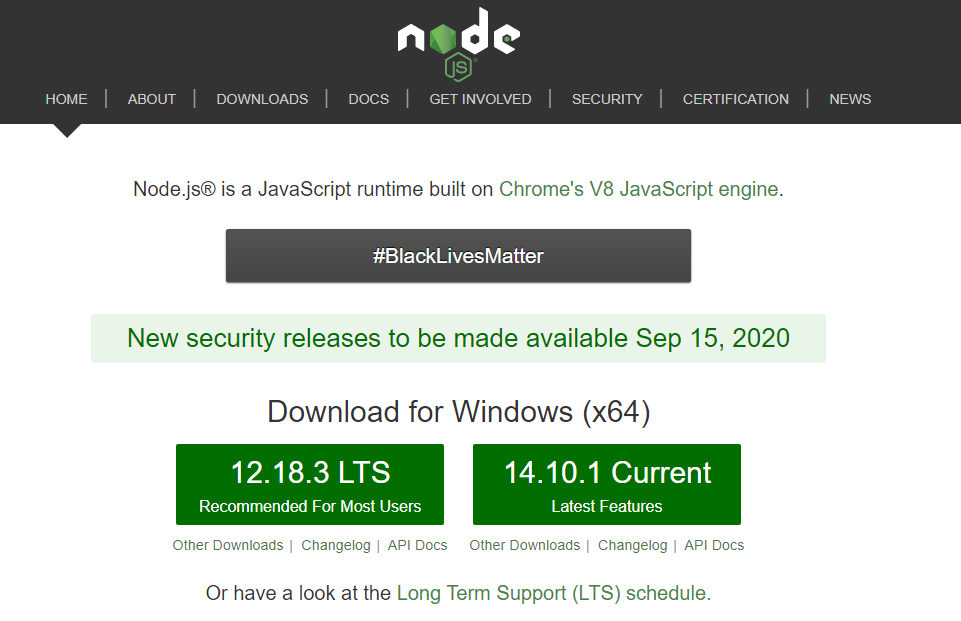
- Node.js
- We require JavaScript runtime Node.js as an extension generator and VSIX package creator. To install Node.js, browse the URL and download the latest stable version.
#azure data studio #data-science