In this post, we will see how to introduce tracing in logs and visualize it easily. We will use Prometheus, Grafana Loki, Jaeger, and Grafana Tempo as data sources for monitoring metrics, logs, and traces respectively in Grafana.
Why Do I Need Tracing if I Have a Good Logging and Monitoring Framework?
Application logs are beneficial for displaying important events if something is not working as expected (failure, error, incorrect config, etc.). Although it is a very crucial element in application design, one should log thriftily. This is because log collection, transformation, and storage are costly.
Unlike logging, which is event triggered and discrete, tracing provides a broader and continuous application view. Tracing helps us understand the path of a process/transaction/entity while traversing the application stack and identifying the bottlenecks at various stages. This helps to optimize the application and increase performance.
In this post, we will see how to introduce tracing in logs and visualize it easily. In this example, we will use Prometheus, Grafana Loki, Jaeger, and Grafana Tempo as data sources for monitoring metrics, logs, and traces respectively in Grafana.
What Is Distributed Tracing?
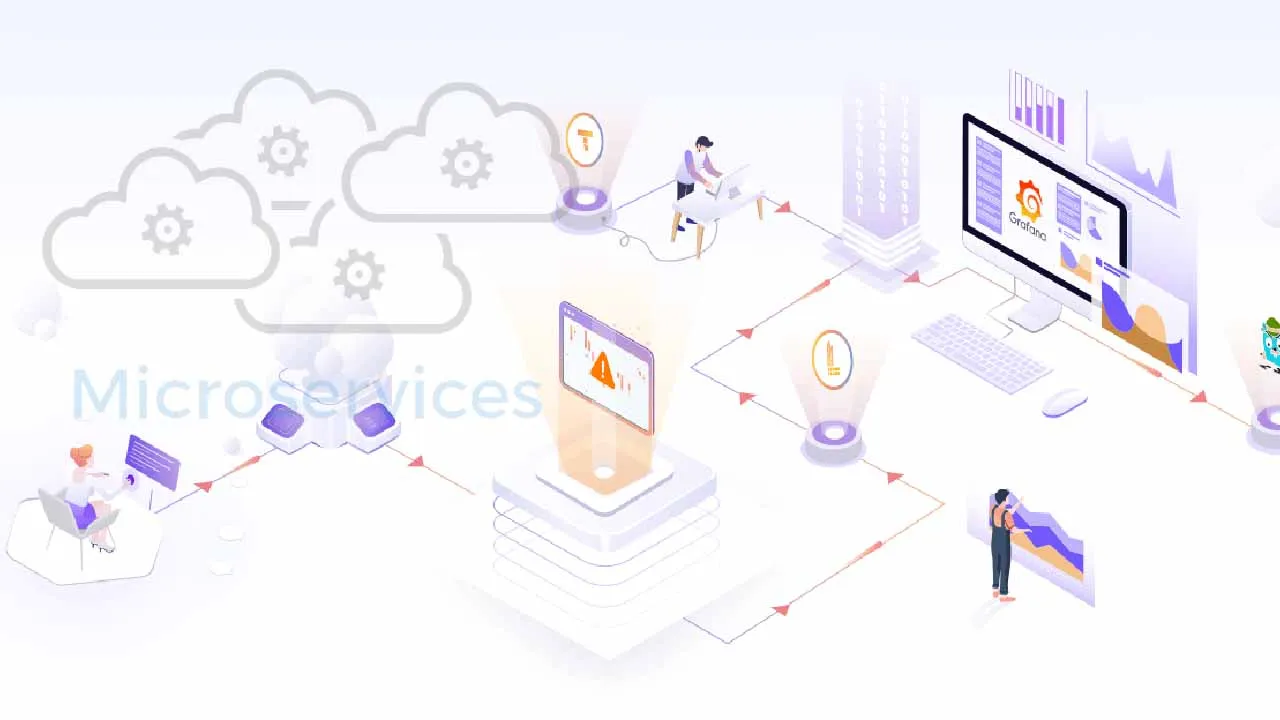
In a microservices architecture, understanding an application behavior can be an intriguing task. This is because the incoming requests may span over multiple services, and each intermittent service may have one or more operations on that request. It thus increases complexity and takes more time while troubleshooting problems.
Distributed tracing helps to get insight into the individual operation and pinpoint the areas of failure caused by poor performance.
What Is OpenTracing?
OpenTracing comprises an API specification, frameworks, and libraries to enable distributed tracing in any application. OpenTracing APIs are very generic and prevents vendor/product lock-in. Recently, OpenTracing and OpenCensus merged to form OpenTelemetry (acronym OTel). It targets the creation and management of telemetry data such as traces, metrics, and logs through a set of APIs, SDKs, tooling, and integrations. Note: OpenCensus consists of a set of libs for various languages to collect metrics and traces from Applications, visualize them locally and send them remotely for storage and analysis.
#tutorial #microservices #monitoring #logging #grafana