The overall goal of this project is to help the ministers focus on areas that will foster economic development for their respective states. Since the most common measure of economic development is the GDP, we will analyse the GDP of the various states of India and suggest ways to improve it
Understanding GDP
Gross domestic product (GDP)at current prices is the GDP at the market value of goods and services produced in a country during a year. In other words, GDP measures the ‘monetary value of final goods and services produced by a country/state in a given period of time’.
GDP can be broadly divided into goods and services produced by three sectors: the primary sector (agriculture), the secondary sector (industry), and the tertiary sector (services).
It is also known as nominal GDP. More technically, (real) GDP takes into account the price change that may have occurred due to inflation. This means that the real GDP is nominal GDP adjusted for inflation. We will use the nominal GDP for this exercise. Also, we will consider the financial year 2015–16 as the base year, as most of the data required for this exercise is available for the aforementioned period.
Per Capita GDP and Income
Total GDP divided by the population gives the per capita GDP,which roughly measures the average value of goods and services produced per person.The per capita income is closely related to the per capita GDP (though they are not the same). In general, the per capita income increases when the per capita GDP increases, and vice-versa. For instance, in the financial year 2015–16, the per capita income of India was ₹93,293, whereas the per capita GDP of India was $1717, which roughly amounts to ₹1,11,605.
We will divide the analysis into two parts
Part-I: GDP Analysis of the Indian States
We will use data available for years 2012–2017
Part-II: GDP and Education Dropout Rates
We will use data for year 2014–2015
Dataset
Data I download:
- Go to the URL: https://data.gov.in/ and search for the keyword ‘State-wise Gross Domestic Product (GDP) at current price on yearly basis’. Select the ‘State-wise Gross Domestic Product (GDP) at current price on yearly basis’ from the search result and download the data.
- Go to the URL: https://data.gov.in/ and search for the keyword ‘GSVA by Economic Activity at Current Prices’. Click on “More Similar Results”. Download the data for all the states, not the union territories
Data II download:
Download the dropout rates data from the link below:
Lets Begin…
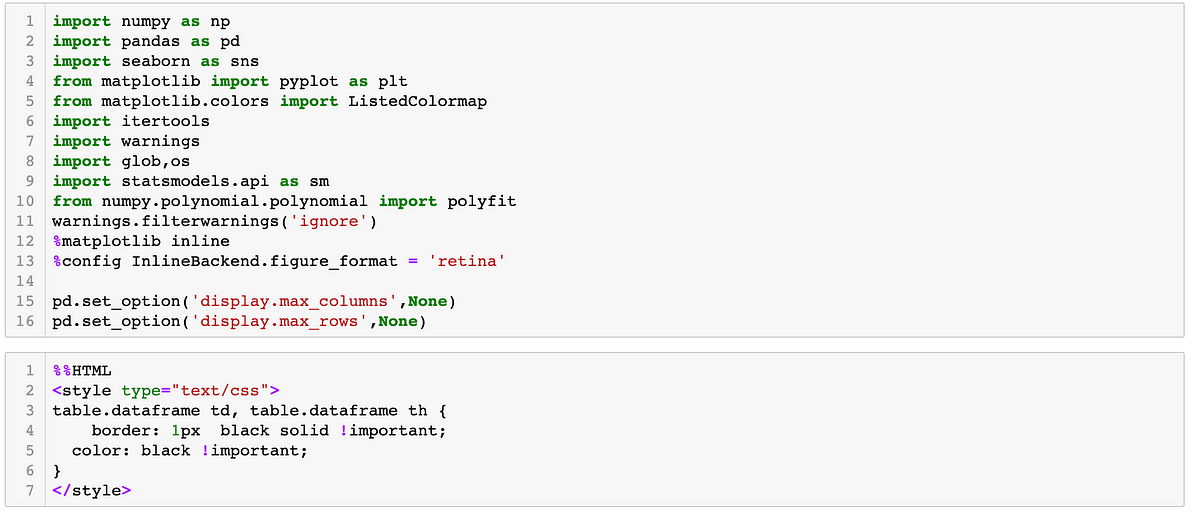
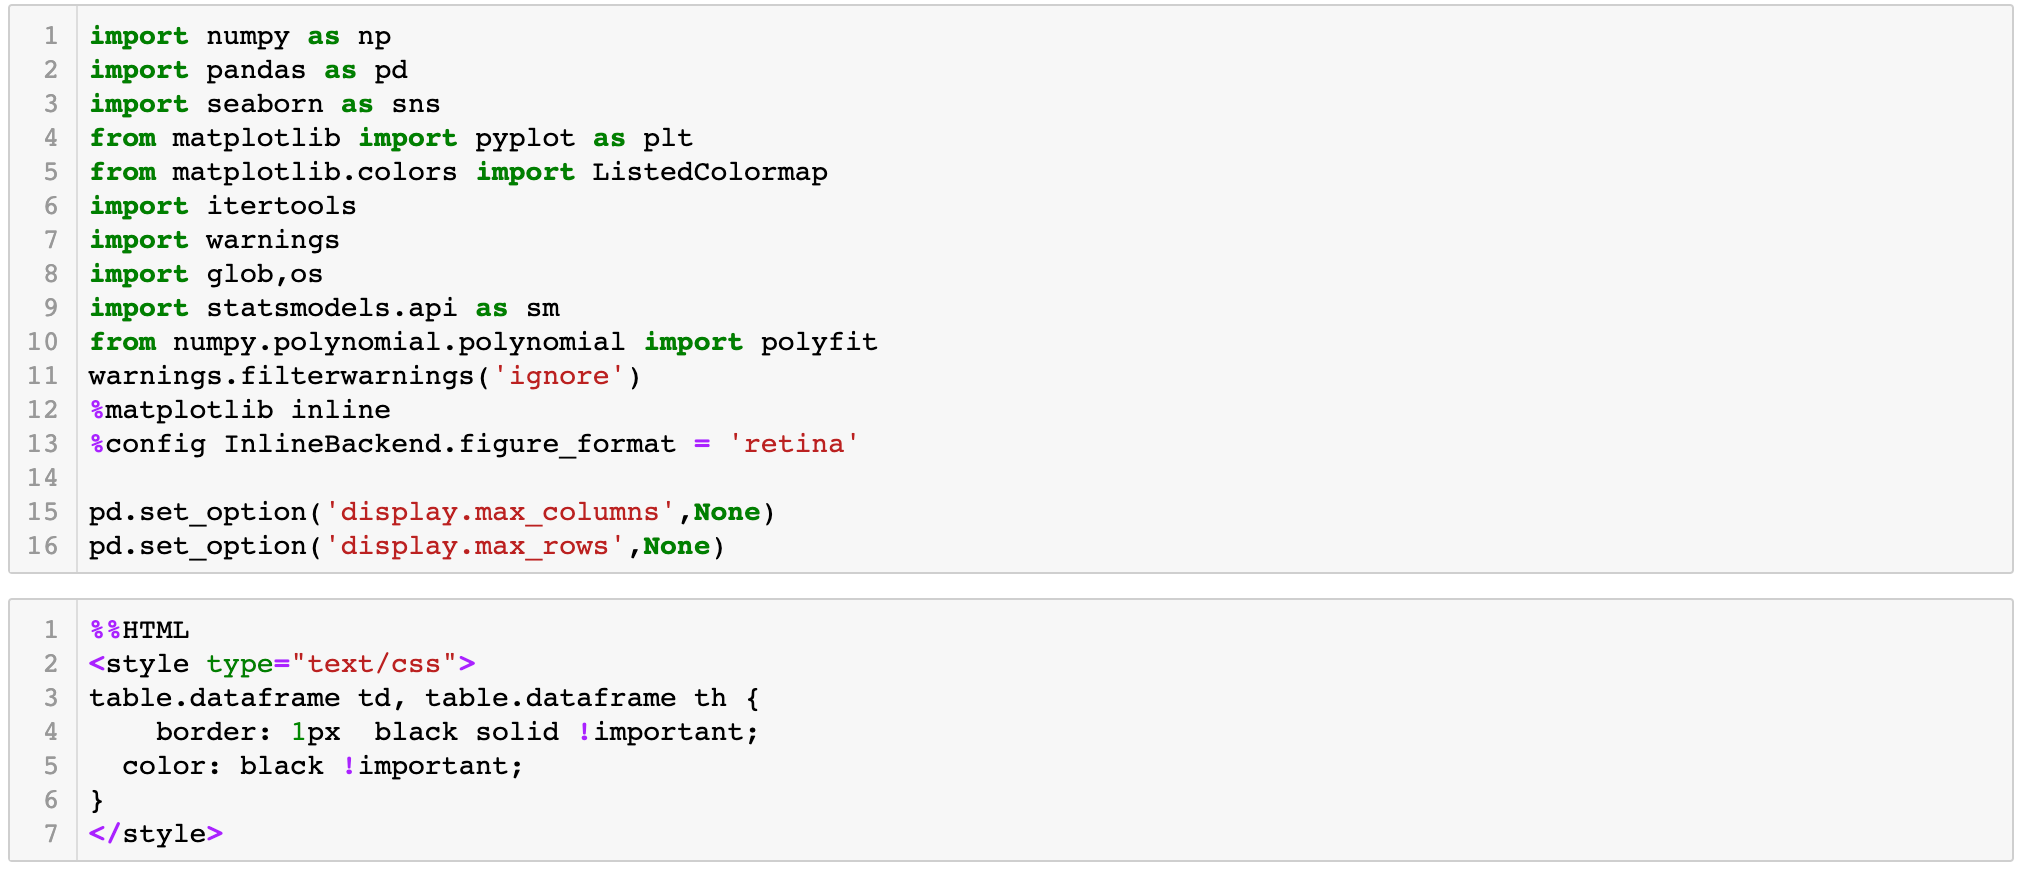
Library Imports
Import all the necessary libraries in python for data analysis
Load Files

Check for Data Type and Column names
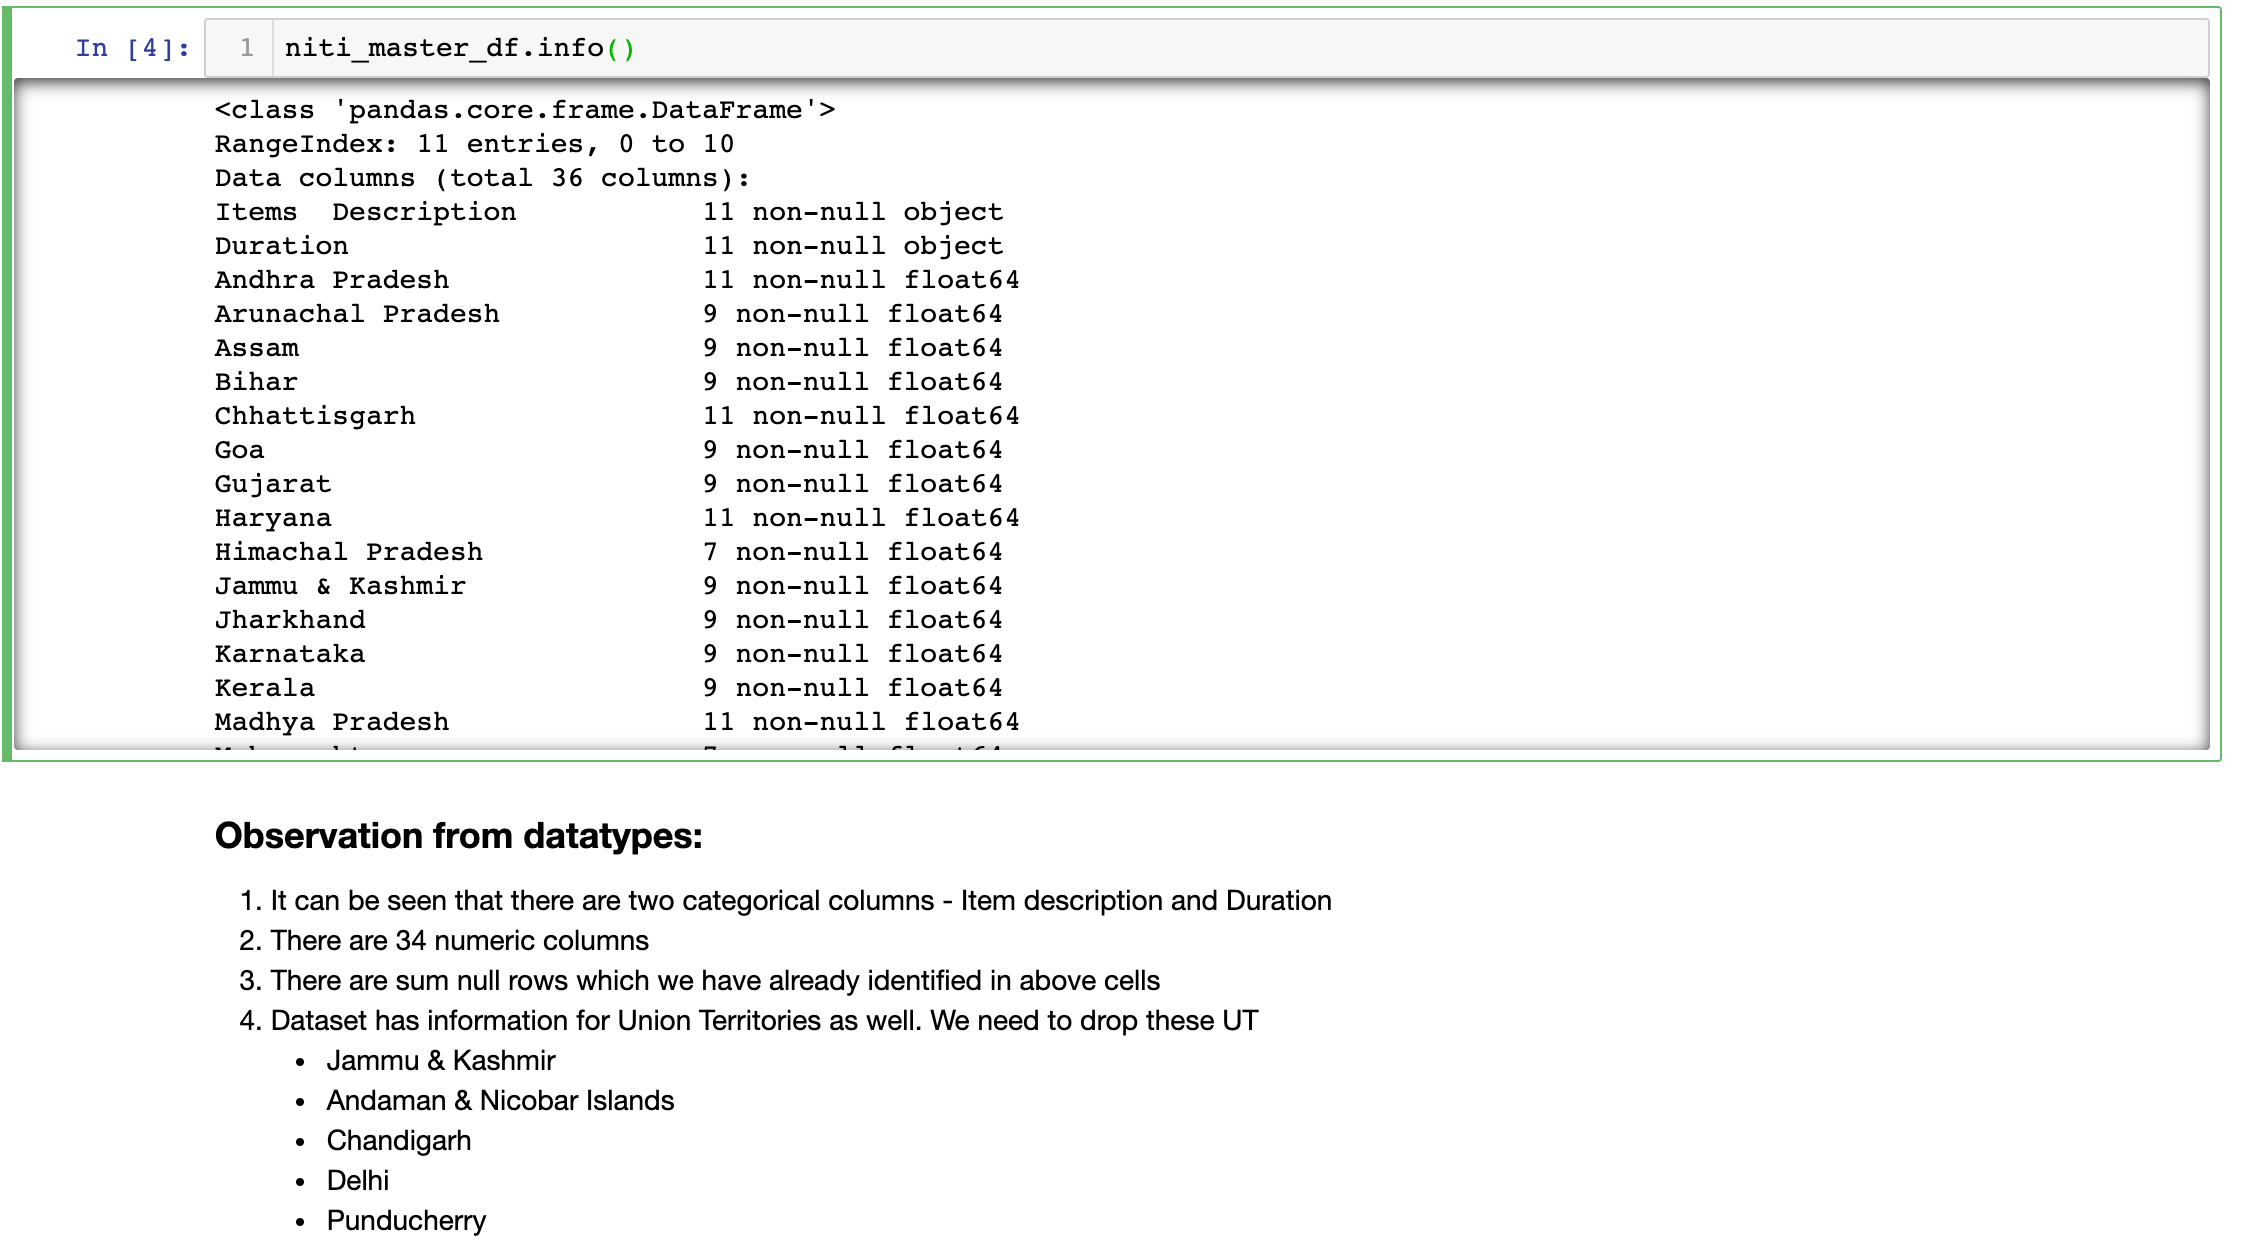
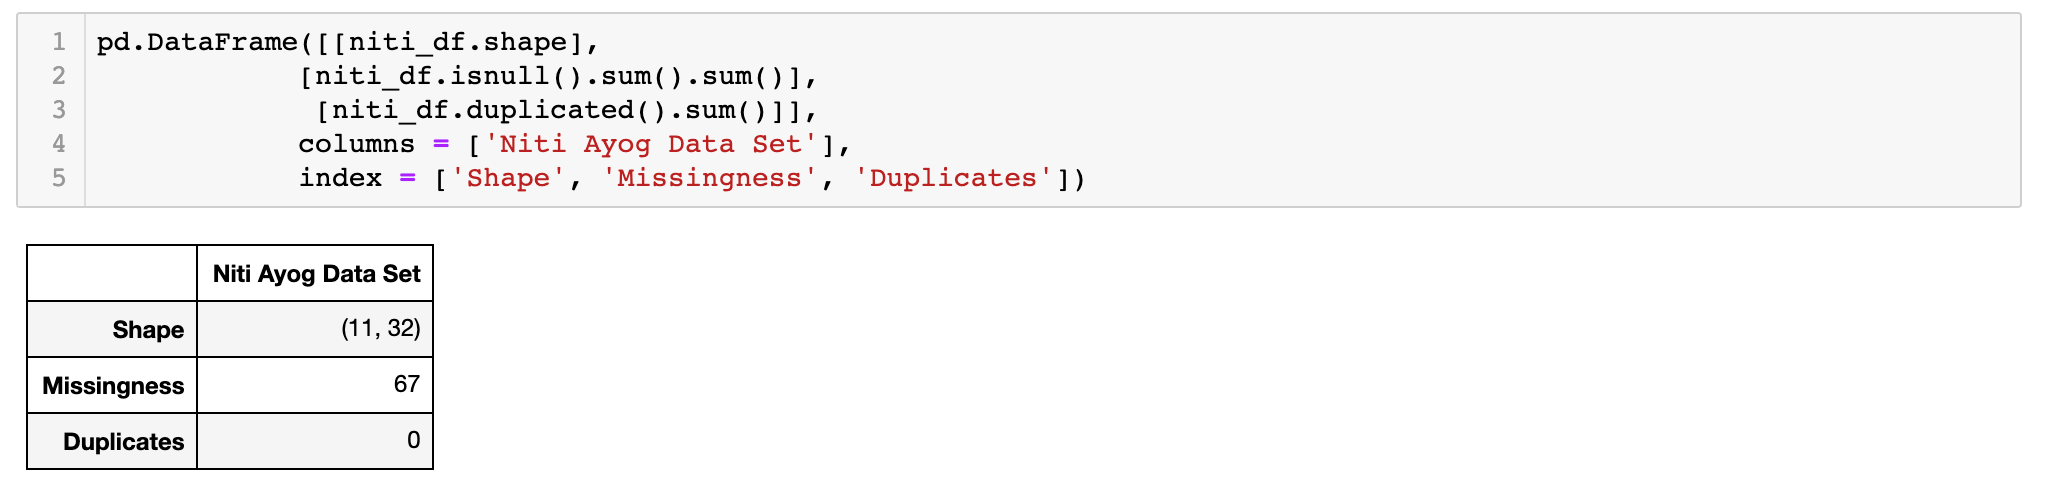
Check for missing values
#data-analysis #data-science #python