Data science starts with data cleaning. We’re often more “data janitors” than the “new Rockstars.”
This is because AI and analytics tools are very picky: The data has to be in just the right format, and anything unexpected throws a wrench into the system.
Duplicate rows, missing values, unsupported filetypes, and a million other flaws can break your analysis before you can say “pie chart.” Here are 7 techniques to clean and structure your data for analysis.
1. Data Quality Analysis
Before diving into data wrangling, we want an overview of the data quality. For this, we can use tools like Excel, Google Sheets, and Python functions like info(), head(), and describe(). These will show us where there are empty values, what the datatypes are, and some basic descriptive statistics.
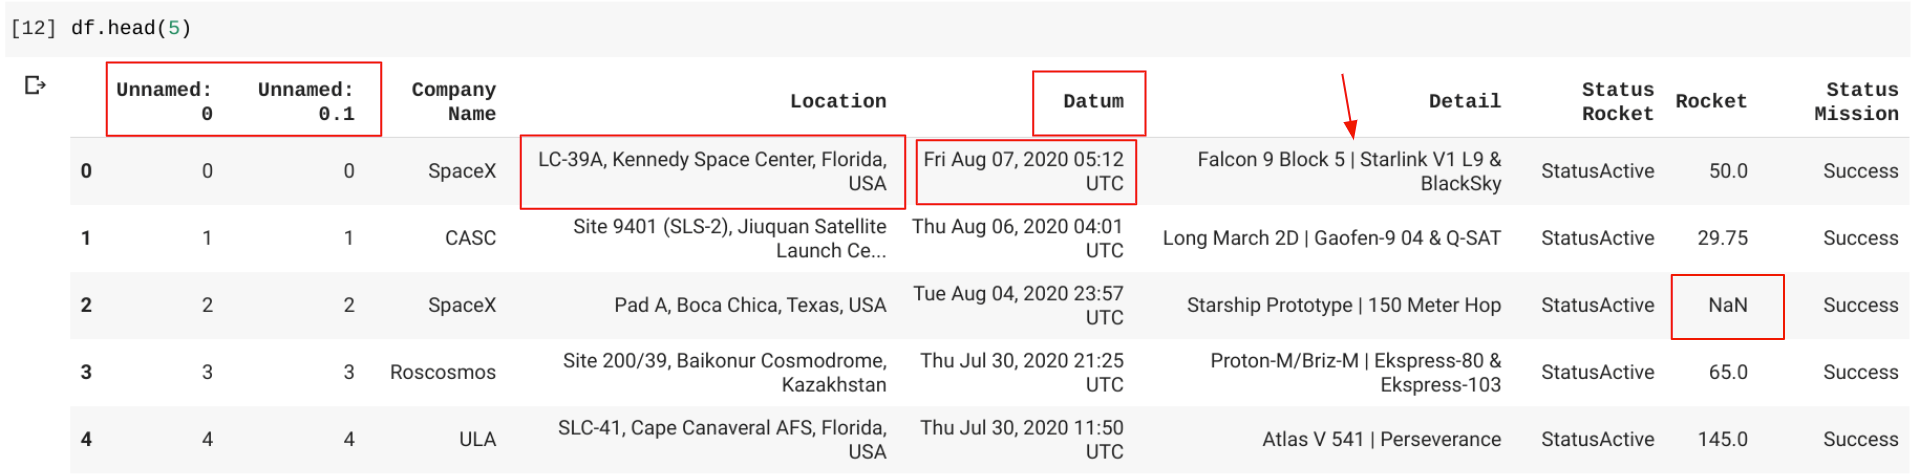
For example, I recently analyzed a dataset of rocket launches. The first thing I did was look at the first few rows and columns, like so:
import pandas as pd
df=pd.read_csv('Space.csv')
df.head(5)
This is functionally identical to just doing a visual inspection in Excel or GSheets, although large datasets don’t mix well with those tools.
I immediately spot a few potential problems. The first two columns are Unnamed, useless columns that we’ll want to get rid of. The Location column has the country inside of a long string, at the end, so we’ll want to separate that out. The Date column is spelled Datum and has the day of the week, month, year, and UTC time all bunched together. The Detail column has a pipe (|) in the middle of the rocket names, so we may want to separate those out as well. The Rocket column has NaN values.
Overall, though, it’s a very clean dataset. Here’s what df.info() gives us.
#data-science #artificial-intelligence #learning-to-code #data #data-analysis #data analysis