This is a part of a series of blogs where I’ll be demonstrating different aspects and the theory of Machine Learning Algorithms by using math and code. This includes the usual modeling structure of the algorithm and the intuition on why and how it works, using Python code.

By the end of this blog you’ll know:
- How Logistic Regression works both mathematically and how to code it.
- Why Logistic Regression is a linear classifier.
- How to evaluate the model you made.
Introduction
Logistic Regression is one of the first algorithms that is introduced when someone learns about classification. You probably would have read about Regression and the continuous nature of the predictor variable. Classification is done on discrete variables, which means your predictions are finite and class-based like a Yes/No, True/False for binary outcomes. However, simply guessing “Yes” or “No” is pretty crude. Something which takes noise into account, and doesn’t just give a binary answer, will often be useful.
In short, we want probabilities, which means we need to fit a stochastic model. What would be nice, in fact, would be to have a conditional distribution of the response Y, given the input variables, P(Y|X ). So, If our model says that there’s a 51% chance of rain and it doesn’t rain, that’s better than if it had said there was a 99% chance of rain (though even a 99% chance is not a sure thing). This is the reason why it’s called Logistic Regression and not classification because it predicts probabilities that are continuous (but bounded).
Pretty neat, right? But, you must be thinking even if the outcomes are finite, linear regression might handle it. There’s a comprehensive answer to this here, It’s quite intuitive, whenever you try to fit a Regression hypothesis curve to a discrete data and introduces an outlier, the line will try to fit the outlier and by making so you need to change your hypothesis threshold to a lesser value otherwise your predictions will get crooked.
Let’s now get to the fun part…
Modeling
We have a binary output variable Y and we want to model the conditional probability P(Y = 1|X = x) as a function of x. Now, Logistic Regression belongs to the Generalized Linear Models (GLMs) family of learning. So the question arises “how can we use linear regression to solve this?”
- The idea is to let P(x) be a linear function of x. Every change in x would affect the probability. The conceptual problem here is that P must be between 0 and 1, and linear functions are unbounded. Moreover, in many situations, we may see “diminishing returns” — changing P by the same amount requires a bigger change in x when P is already large (or small) than when p is close to 1/2. Linear models can’t do this.
- The next best idea is to let log(P(x)) be a linear function of x so that changing an input variable multiplies the probability by a fixed amount.
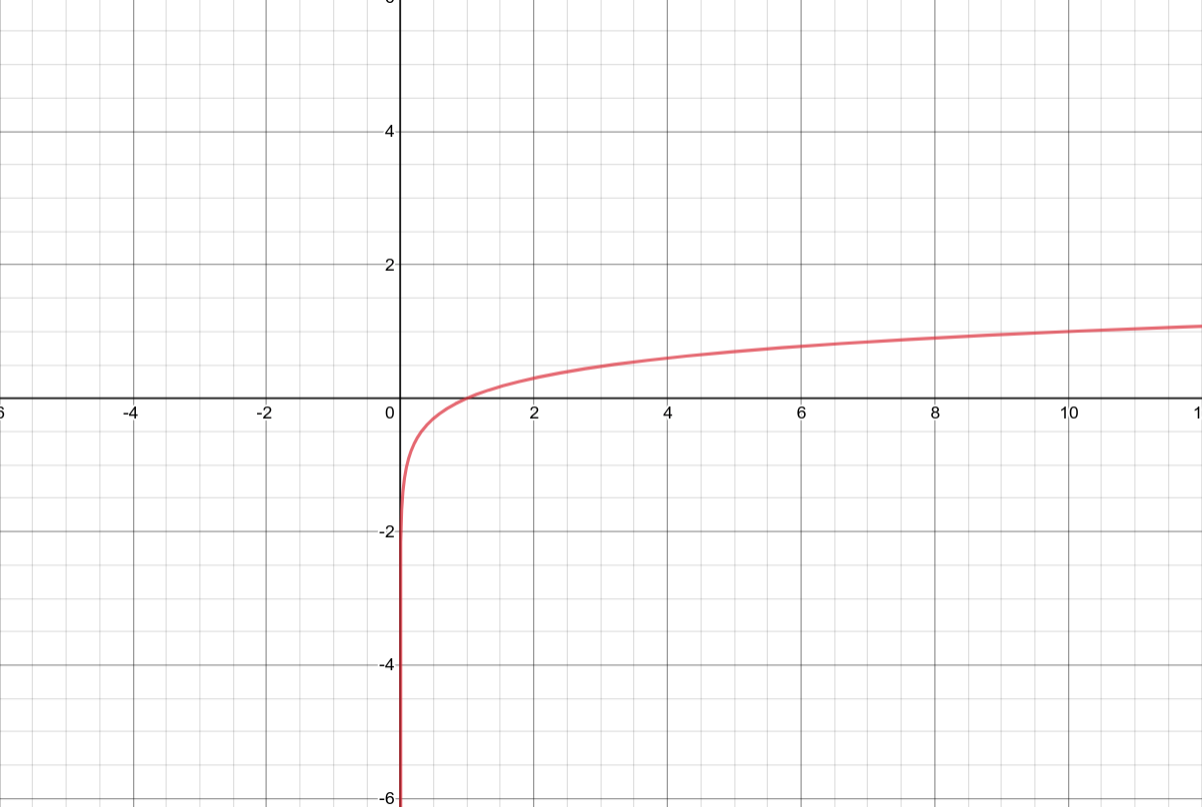
Fig:1-log(x) curve
As you can see above, logarithms are bounded in only one direction. This means that a change in x in a positive direction may not significantly impact the result as compared to a negative change will.
#p-value #statistics #machine-learning #classification #logistic-regression #deep learning