Building and simulating different stock portfolio and assessing risk and return with Python and R Shiny
Building a portfolio is easier said than done. The sheer amount of combination possibilities is overwhelming. Furthermore, it is oftentimes not completely clear what a certain stock combination will do to the portfolio return and risk. This blog-post clarifies how to determine the portfolio risk and return by showing a two-asset example before moving on to the general n-asset example.
Before starting, we declare the needed packages in Python as well as the directories we are going to need. Furthermore we import the a function which creates financial return data by inputting the
## Packages
import os
import numpy as np
import pandas as pd
import matplotlib.pyplot as plt
from tqdm import tqdm
import quandl
import datetime as dt
import scipy.optimize as solver
## Paths
main_path = r"/Users/user/Documents/projects/markowitz"
raw_path = r"{}/00 Raw".format(main_path)
code_path = r"{}/01 Code".format(main_path)
data_path = r"{}/02 Data".format(main_path)
output_path = r"{}/03 Output".format(main_path)
Portfolios of Two Risky Assets
When having a multi-asset portfolio there are not many levers we can pull to alter the portfolio’s return and variance. The average return, the risk (standard deviation) of a financial asset as well as the correlation between the two assets is fixed. The only thing we have influence over is how much weight we put on each asset. That means we have to ask ourselves how we should split our capital on the acquisition of both assets, how much of each asset we should buy.
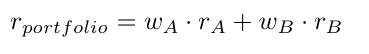
As an example we take the stocks, Apple Inc. (abbreviated as A) and Bank of America (abbreviated as B). Furthermore we denote _w _as the weight of a respective stock and _r _and σ as the return and standard deviation respectively. The return of the portfolio containing these two stocks is then calculated as the simple weighted average of theses stocks
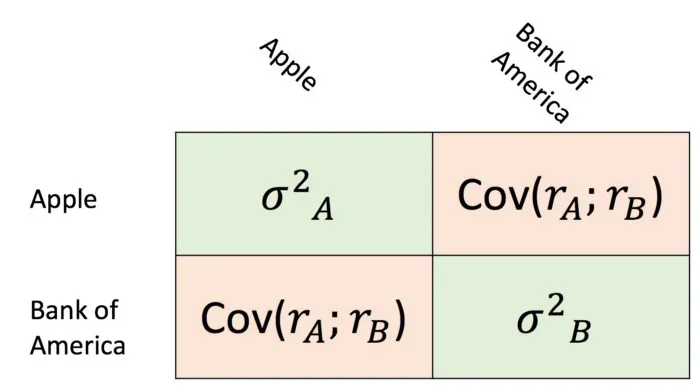
The portfolio variance is denoted as sum of the covariance matrix of these two stocks. This becomes clear when looking at the formula below in addition to the covariance matrix.
#phyton #portfolio-management #r-shiny #ai #dashboard