One of my friends asked me a problem — “how can we compare the BOW across different categories or labels? Where categories or labels could be sentiment or state or some customer segment.
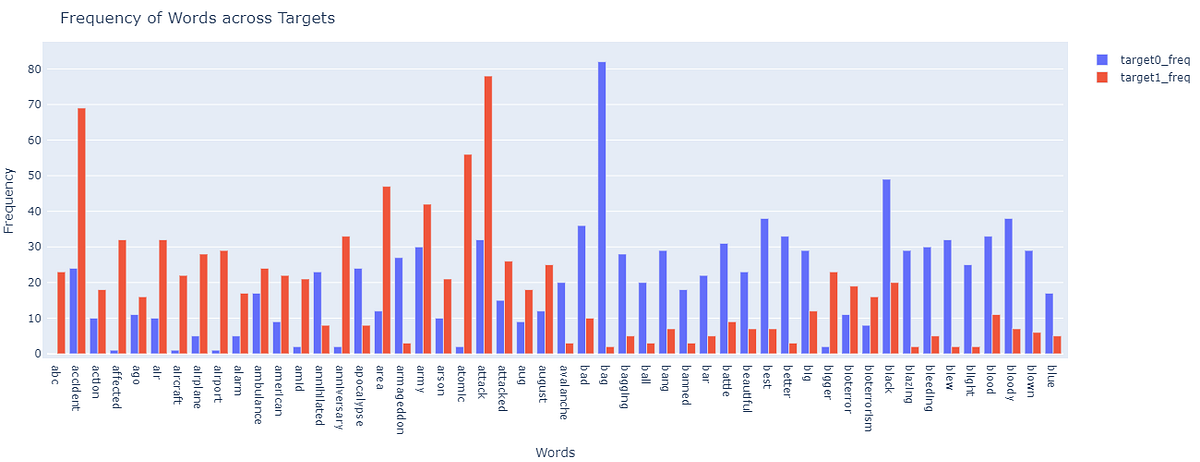
My intuitive response was — to create a Bar graph of the frequency of words for each category. This really is a simple to implement solution, but have various drawbacks, some of which are:
- The data scientist/analyst working on this will be required to compare words and their frequencies across all the categories, which in some cases like countries or could easily get over 100
- Comparing the frequencies may not give any insights. For example, we have a word — “data” and its frequency across label1 and label2 be 150 & 100 respectively. Yes, indeed there is a difference of 50 but is this difference even relevant?
- What if -I want to know what are the top words which differentiate these categories without building a model/classifier, is there even a way to tell that?
Then the next idea was to create a Word Cloud, but even it does not solve the above-mentioned problem.
After thinking for a while I knew that solution lies in comparing the frequencies across the categories, but could not find the answer in One-Hot Encoding or Count Vectorizing or TF-IDF as there is a common issue in using any of these.
The issue is these create features and their values, for each of the documents, and then how can we roll these up at the label/category level? Even let’s take the case of Count Vectorizer — we will get the frequencies of words present in each document — but to do any analysis at the label/category level we will be required to sum up the counts and roll up to category level. Once we roll up, we can definitely make the difference in frequencies of words across labels but again — it won’t solve the third issue mentioned above. That is if the difference of frequency of word ‘data’ is 50, what does it tell us? Is this even significant?
Now, you can guess where are we headed — we have differences in frequencies and we want to know if the differences are significant or not. With this comes the **STATISTICS **to our rescue.
I am assuming you are aware of the various tests like z-test, t-test, ANOVA, etc. We use these tests to compare multiple means or distributions, which aligns with the problem we are trying to solve here.
The below table contains the frequency of a word across the labels — Target-0 and Target-1., which is nothing but the distributions. We can easily use the tests like z-test, t-test, etc. and compare these distributions and if the difference turns out to be significant (given the significance level) we can say that such words have different distributions across the labels and hence, can be the distinguishing factors in the model.
#feature-engineering #machine-learning #data-science #statistical-analysis