My Capstone Project of Udacity Data Scientist Nanodgree

https://upswell.org/2018/10/01/what-the-heck-is-a-spark-talk/
Churn prediction, namely predicting clients who might want to turn down the service, is one of the most common business applications of machine learning. It is especially important for those companies providing streaming services. In this project, an event data set from a fictional music streaming company named Sparkify was analyzed. A tiny subset (128MB) of the full dataset (12GB) was first analyzed locally in Jupyter Notebook with a scalable script in Spark and the whole data set was analyzed on the AWS EMR cluster. Find the code here.
Data preparation
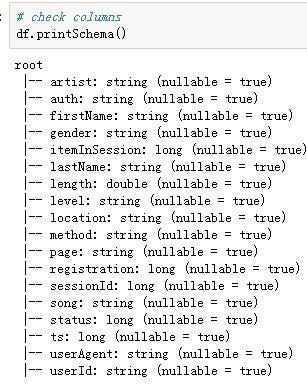
Let’s first have a look at the data. There were 286500 rows and 18 columns in the mini data set (in the big data set, there were 26259199 rows). The columns and first five rows were shown as follows.
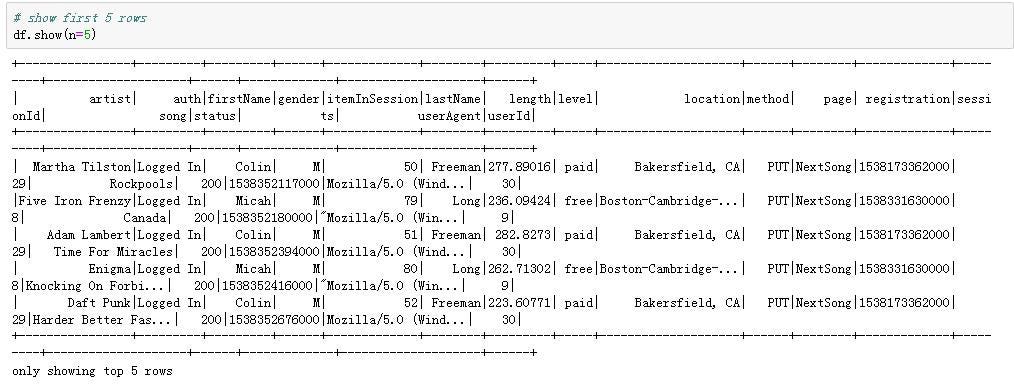
First five rows of the dataframe
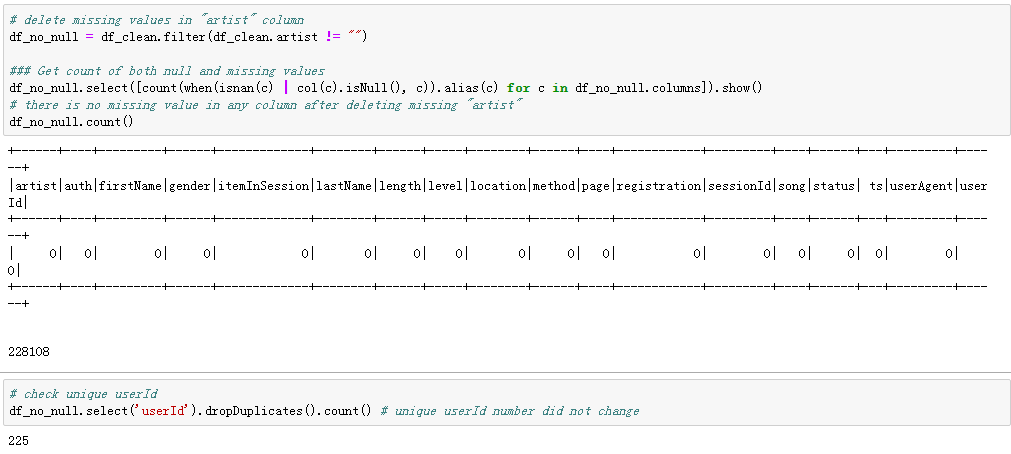
Let’s check missing values in the data set. We will find a pattern from the table below in the missing values: There was the same number of missing values in the “artist”,” length”, and the ”song” columns, and the same number of missing values in the “firstName”, “gender”, “lastName”, “location”,” registration”, and ”userAgent” columns.
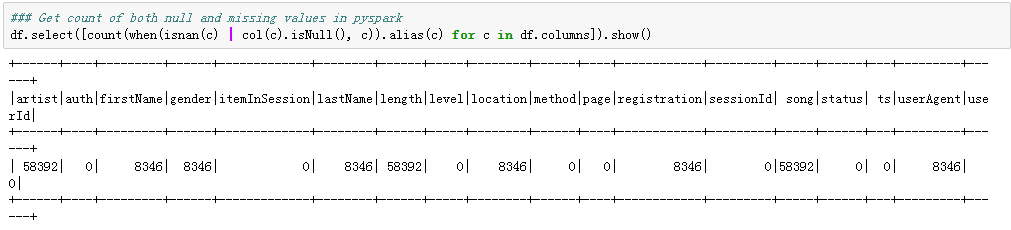
Missing values in the dataframe
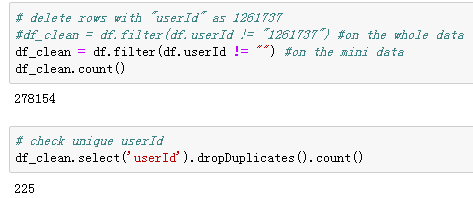
If we see closer at the “userId”, whose “firstName” was missing, we will find that those “userId” was actually empty strings (in the bid data was the user with the ID 1261737), with exactly 8346 records (with 778479 rows in the bid data), which I decided to treat as missing values and deleted. This might be someone who has only visited the Sparkify website without registering.
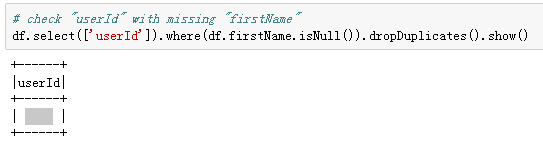
Empty strings in UserId
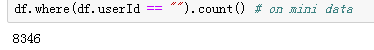
Number of missing UserId
After deleting the “problematic” userId, there was 255 unique users left (this number was 22277 for the big data).
Let’s dig further on remaining missing values. As the data is event data, which means every operation of single users was recorded. I hypothesized that those missing values in the “artist” column might have an association with the certain actions (page visited) of the users, that’s why I check the visited “pages” associated with the missing “artist” and compared with the “pages” in the complete data and found that: “missing artist” is combined with all the other pages except “next song”, which means the “artist” (singer of the song) information is recorded only when a user hit “next song”.

Categories in “page” column
If I delete those “null” artist rows, there will be no missing values anymore in the data set and unique users number in the clean data set will still be 255.
After dealing with missing values, I transformed timestamp into epoch date, and simplified two categorical columns, extracting only “states” information from the “location” column and platform used by the users (marked as “agent”) from the “userAgent” column.
The data cleaning step is completed so far, and let’s start to explore the data and find out more information. As the final purpose is to predict churn, we need to first label the churned users (downgrade was also labeled in the same method). I used the “Cancellation Confirmation” events to define churn: those churned users who visited the “Cancellation Confirmation” page was marked as “1”, and who did not was marked as “0”. Similarly who visited page “Downgrade” at least once was marked as “1”, and who did not was marked as “0”. Now the data set with 278154 rows and columns shown below is ready for some exploratory analysis. Let’s do some comparisons between churned and stayed users.

#aws #data-science #churn-prediction #spark #pyspark #data analytic