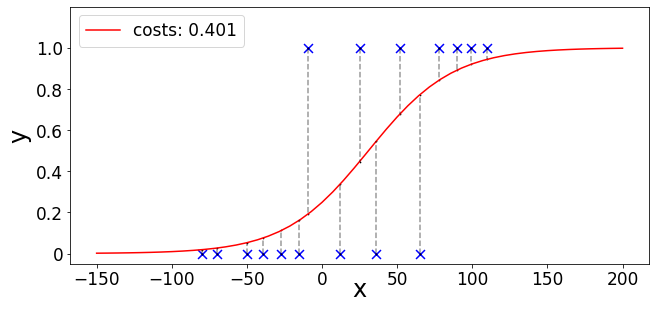
This article is about creating animated plots of simple and multiple logistic regression with batch gradient descent in Python. In the end, I will also present a visual explanation of why the cross-entropy cost function is the method of choice to quantify costs in logistic regression. In terms of structure and content, this article relates to — and partially builds on — previous articles I wrote about creating animations of batch gradient descent with the example of simple linear and multiple linear regression . The general idea is to set up a logistic regression model and train the model on some arbitrary training data while storing parameter values and costs for each epoch. After confirming our results through sklearn’s built-in logistic regression model, we will use the stored parameter values to generate animated plots with Python’s celluloid module . The animations we use to visualize logistic regression will be similar to the ones we created for previous articles on linear regression.
#animation #python #statistics #regression #machine-learning
