Not familiar with tools like Python or R?
It’s perfectly fine! You can still perform a regression analysis using Excel. And you don’t need to have any programming knowledge to do that.
Excel is undoubtedly a very powerful tool when it comes to data analysis. You can do data cleaning, perform analysis using pivot tables, design visuals and much more.
If you’re looking to explore more on data analysis using Excel, here are a few excellent resources you can check out.
Data cleaning: 10 Super Neat Ways to Clean Data in Excel Spreadsheets
Data analysis: Introduction to Data Analysis using Excel
Pretty amazing right!
But wait. There’s more!
Excel has an add-in called “Data Analysis ToolPak” that allows you to perform various statistical operations, including Regression just with the click of a button.
Now that we’ve talked enough about Excel, let’s move on to Regression.
What is Regression?
I’m simple terms; Regression is the process of determining the relationship between the dependent variable and a set of independent variables.
Consider the following example:

This table shows the relationship between the advertising cost spent on TV with the respective sales revenue.
Now if you need to find the relationship between the two variables, the most straightforward way is to plot a scatter plot which looks like this.
Observing the plot, we can say that there is a positive relationship between the ad spent on TV and sales revenue.
That’s a sign of positive correlation.
Now, let’s say that we need to quantify the relationship. How will you do that?
Again, it’s pretty simple. Just draw a line that best fits all the points shown in the scatter plot, and the line equation will give you the relationship between variables.

Sales = 0.0555*(TV) + 6.9748
That’s the basic idea of Regression. It is quantifying the relationship between variables by fitting all points using a function.
The method used to determine the best fitting line is out of the scope of this article. But if you’re interested, it’s done by a technique called ordinary least squares.
The example that we just saw is called simple linear Regression which involves only one independent variable or feature (advertising cost on TV).
But the same concept of Regression can be expanded to multiple independent variables or features, which is called multiple linear Regression.
For example, check out this table.
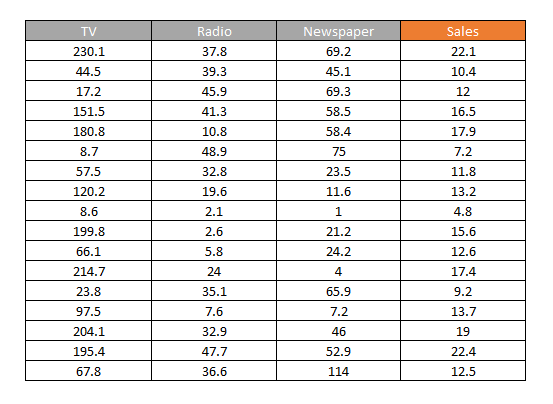
Here, we have advertising costs spent on TV, radio and newspaper along with the respective sales revenue.
We won’t be able to visualise the relationship on a 2D plane, but the concept of linear Regression can still be applied to determine the best fitting function for all these points.
And the function will be of the form:
Sales = 0.0544*(TV) + 0.1070*(Radio) + 0.0003*(Newspaper) + 4.6251
So this is the basic idea behind Regression.
Now let’s look at how to implement Regression using Excel.
The first step is the add data analysis toolpak
#data-science #regression #data-analysis #excel #statistics #data analysis