This is a tutorial to share what I have learnt in Supervised Learning with scikit-learn, capturing the learning objectives as well as my personal notes. The course is taught by Hugo Bowne-Anderson from DataCamp and includes 4 chapters:
Chapter 1. Classification
Chapter 2. Regression
Chapter 3. Fine-tuning your model
Chapter 4. Preprocessing and pipelines
Is a particular email spam?
Will a tumor be benign or malignant?
Which of your customers will take their business elsewhere?
These questions can be answered by Machine learning algorithms, where computers learn from existing data to make predictions on new data.
In this course, you’ll learn how to use Python to perform supervised learning, an essential component of machine learning. You’ll learn how to build predictive models, tune their parameters, and determine how well they will perform with unseen data — all while using real world datasets. You’ll be using scikit-learn, one of the most popular and user-friendly machine learning libraries for Python.
Chapter 1. Classification
In this chapter, you will be introduced to classification problems and learn how to solve them using supervised learning techniques. And you’ll apply what you learn to a political dataset, where you classify the party affiliation of United States congressmen based on their voting records.
Supervised learning
Supervised learning is giving computers the ability to learn to make decisions from _labelled _data without being explicitly programmed. Example, to predict whether an email is spam or not (classification), or to predict life expectancy (regression).
Features = predictor variables = independent variables
Target variable = dependent variable = response variable
Unsupervised learning is used to uncover hidden patterns by clustering, using _unlabeled _data. Example, to cluster wikipedia entries into different categories, or to group customers into distinct categories based on purchasing behavior.
Reinforcement learning is when machines or software agents interact with an environment. Reinforcement agents optimise their behaviour given a system of rewards and punishments.
Which of these is a classification problem?
Once you decide to leverage supervised machine learning to solve a new problem, you need to identify whether your problem is better suited to classification or regression.
Provided below are 4 example applications of machine learning. Which of them is a supervised classification problem?

Answer: Using labeled financial data to predict whether the value of a stock will go up or go down next week. There are two discrete, qualitative outcomes: the stock market going up, and the stock market going down. This can be represented using a binary variable, and is an application perfectly suited for classification.
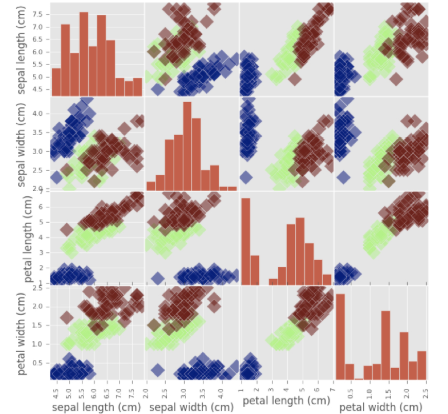
Exploratory data analysis (EDA)
Explore the Iris dataset, explore flower characteristics (4 features) in columns and the 3 target species types. EDA can be visually displayed using pd.plotting.scatter_matrix() function.
Numerical EDA
In this chapter, you’ll be working with a dataset obtained from the UCI Machine Learning Repository consisting of votes made by US House of Representatives Congressmen. Your goal will be to predict their party affiliation (‘Democrat’ or ‘Republican’) based on how they voted on certain key issues. Here, it’s worth noting that we have preprocessed this dataset to deal with missing values. This is so that your focus can be directed towards understanding how to train and evaluate supervised learning models. Once you have mastered these fundamentals, you will be introduced to preprocessing techniques in Chapter 4 and have the chance to apply them there yourself — including on this very same dataset!
Before thinking about what supervised learning models you can apply to this, however, you need to perform Exploratory data analysis (EDA) in order to understand the structure of the data.
Get started with your EDA now by exploring this voting records dataset numerically. Use pandas’ .head(), .info(), and .describe() methods on DataFrame df. Select the statement below that is not true.

Answer: There are 17 predictor variables, or features, in this DataFrame.

Observation: The number of columns in the DataFrame is not equal to the number of features. One of the columns 'party' is the target variable.
#pipeline #machine-learning #supervised-learning #regression #classification #deep learning