GCP offers a suite of cloud technologies with fully managed and serverless solutions that make processing, storing, and analyzing data easy. This analysis will utilize BigQuery, Geo Viz, and AI platform.
GCP offers $300 of trial credits to new users. Additionally, BigQuery comes with 1TB of free processing a month. This demo uses a fraction of these credits.
BigQuery is a serverless data warehouse and analysis tool with a familiar SQL interface. It has GIS capabilities for geospatial analysis, which makes it an ideal tool for any environmental assessment. Additionally, BigQuery offers many publicly available datasets, including EPA’s historical data.
The U.S. EPA maintains a comprehensive monitoring network of many harmful air contaminants, including ozone (O₃), nitrogen oxides, and particulate matter. This network ensures air quality is meeting national air quality standards and assists in analyzing and modeling air pollution patterns.
We will focus on daily ozone summaries, which are easily accessible on BigQuery. This dataset can be unwieldy because of the massive amount of information from monitors across the country that contain daily recordings.
ETL
First thing is to create a dataset in BigQuery to hold the data we will be processing in tables, name the dataset EPAO3.
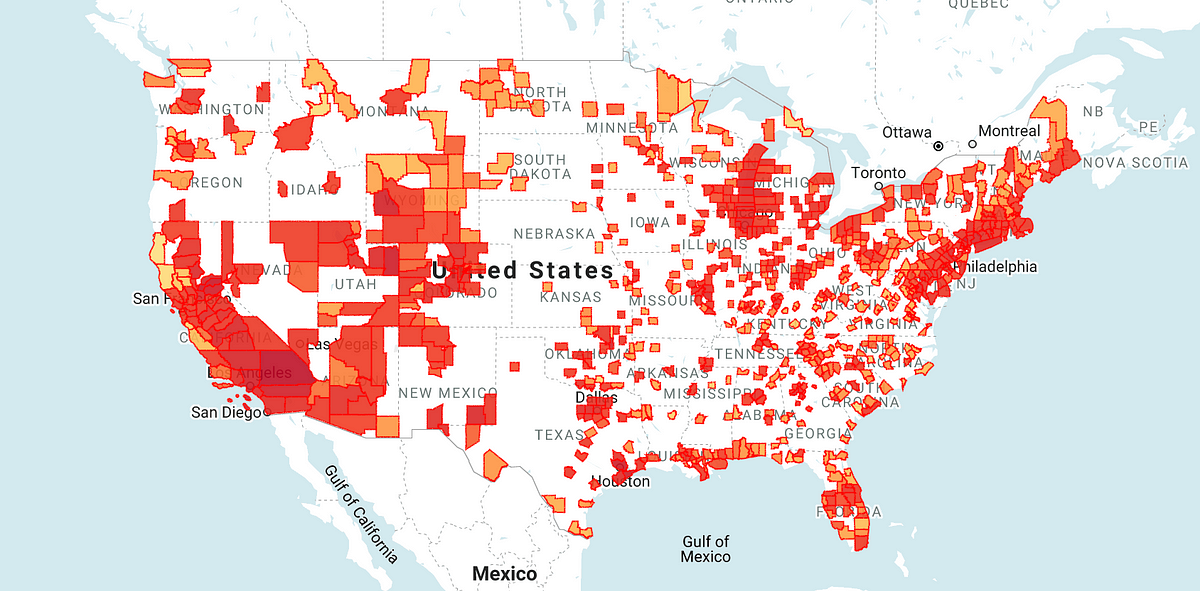
Next we query EPA’s daily ozone and do a max aggregation of daily maximum ozone grouped by county, state, and month. We join this data with county geometries from the 2016 US census to make the data viewable in Geo Viz. The query results are stored as a new table within our dataset called o3monthlymax.
#gcp #time-series-forecasting #bigquery #air-pollution #cloud-computing #cloud