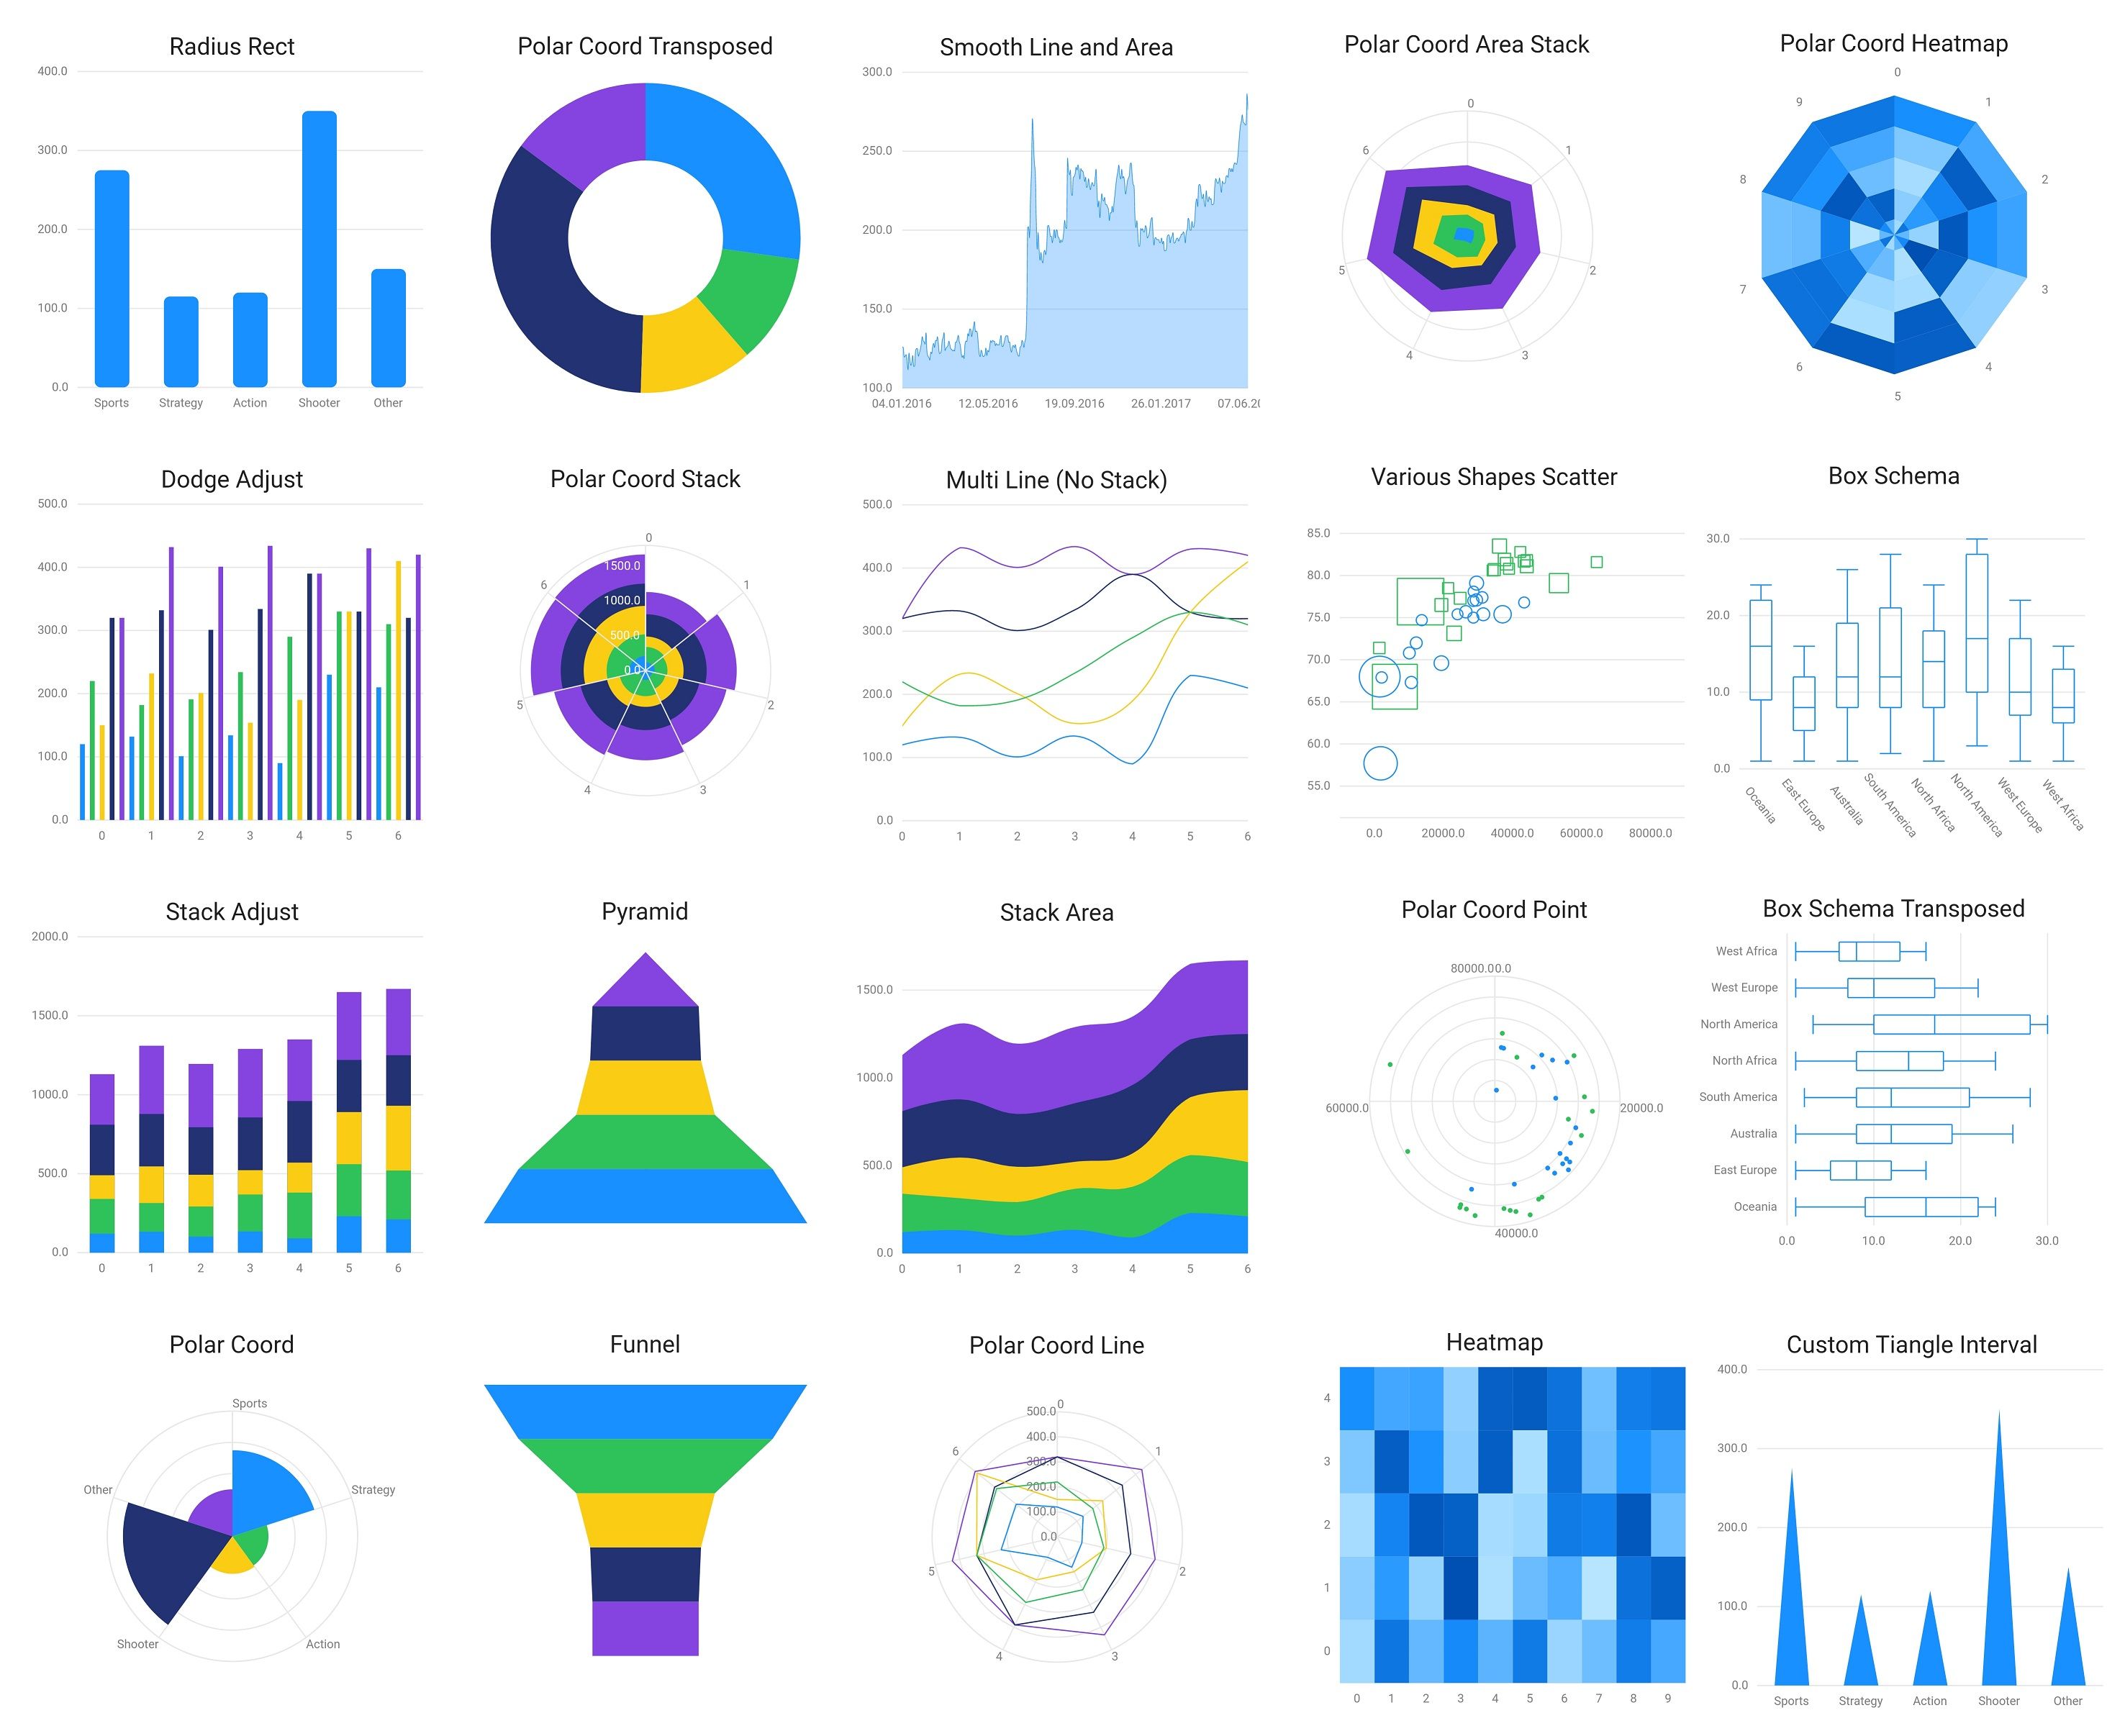
Data visualization is a common but important part of application development. A good visualization library always makes it easier to build data visualization charts. But unfortunately, there is not yet a perfect visualization library in the Flutter community. The current candidates all have some unsatisfactoriness, such as:
- charts_flutter is developed by Google, and has very fine code quality. But it provides very limited chart categories. It lacks some commonly used features like smooth lines. Besides, it seems to be an experimental projects witch has no documents or manuals. Although it’s code is uploaded to GitHub, it is not open to any issue or PR. It has no new features updated for a long time.
- fl_chart is the most popular visualization library on pub.dev. It has cool designs and animations. It is developed by an Iran handsome . But it has too much personal style for some statistics or serious situations.
- syncfusion_flutter_charts is very complete and professional. But it’s a commercial product and not open sourced. It needs paid licenses. That’s not suitable for many developers.
#flutter-app #data-visualisation #charts #flutter

9.30 GEEK