From there you commit to your GitHub repository, update whatever Kaggle notebook you were on, close your computer, pat yourself on the back, and call it a productive day! ……Well, I wish data science was that straightforward.
However, there is a question that you need to ask yourself though. Is this model any good?
In this post, we will be going through a quick overview of some common classification evaluation metrics to help us determine how well our model performed. For simplicity’s sake, let’s imagine we’re dealing with a binary classification problem, such as fraud detection and food recall.
Before we start, repeat after me. “There is no single evaluation metric that is “on the money” for any classification problem or any other problem.”
Great, now repeat this mantra whenever you’re are evaluating your models.
Okay great, let’s start with the simplest metric available being “accuracy”. It’s popular and very easy to measure. But it’s too simplistic, and it doesn’t really tell us the full picture. Now repeat the mantra again. “There is no single evaluation metric that is “on the money” for any classification problem or any other problem.”
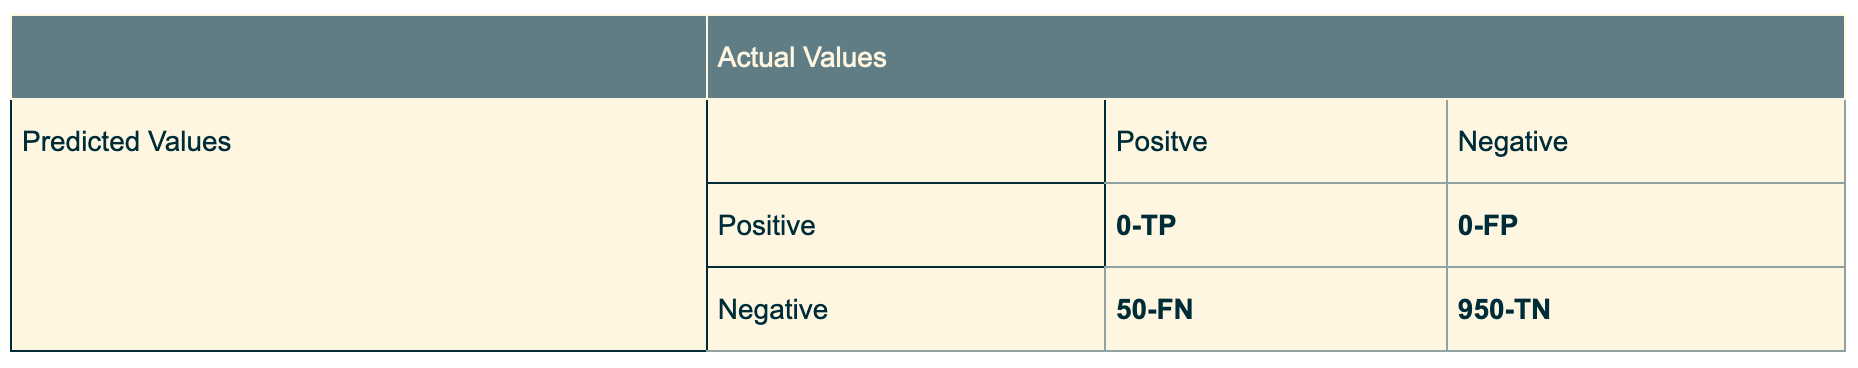
Let me give you an example, say you have data set comprising 1000 data points, with 950 being class 0, and 50 being class 1. Assuming class 0 represents correctly printed books, and class 1 represents books that are faulty, let’s assume the faultiness was that they printed it upside down. We create a simple model and behold our accuracy is 95%.
With little knowledge of the context, we might tell ourselves “This is a great model! Let’s launch this thing into production!” However, because of this highly imbalanced data set, our model may have just classified everything as class 0, misclassifying our faulty book, thus our accuracy is 95% having all our class 0 correctly classified. We can quickly check if this is true by calculating the “null accuracy” which refers to the accuracy that is achieved by always predicting the most frequent class.
Now repeat after me. “There is no single evaluation metric that is “on the money” for any classification problem, or any other problem.”
To dig into our accuracy score and break it down further, one tool that many data scientist like to use is the confusion matrix. It’s not an evaluation metric, but it does the job at highlighting the “types” of errors our classifier is making for each class.
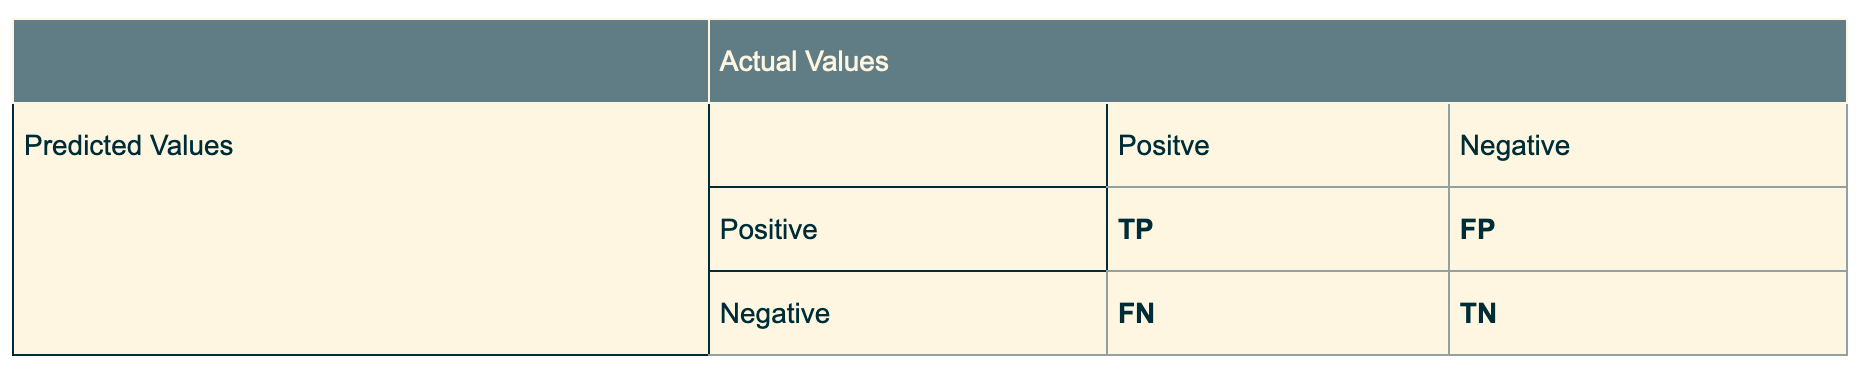
Let’s image our predicted values as our model’s actual prediction performance, with the top row having our model predicting that data point as positive, and bottom row having our model predicting that data point as negative.
- True Positive (TP) refers to predicting a positive class as positive. Meaning it correctly classified it.
- False Positive( FP) refers to predicting a negative class as positive. Meaning it failed to classify it properly.
- False Negative (FN) refers to predicting a positive class as negative. Meaning it failed to classify it properly.
- True Negative (TN) refers to predicting the negative class as negative. Meaning it correctly classified it.
Going back to our faulty book example, our model confusion matrix would have looked like this.
#evaluation-metric #statistics #confusion-matrix #data-science #towards-data-science