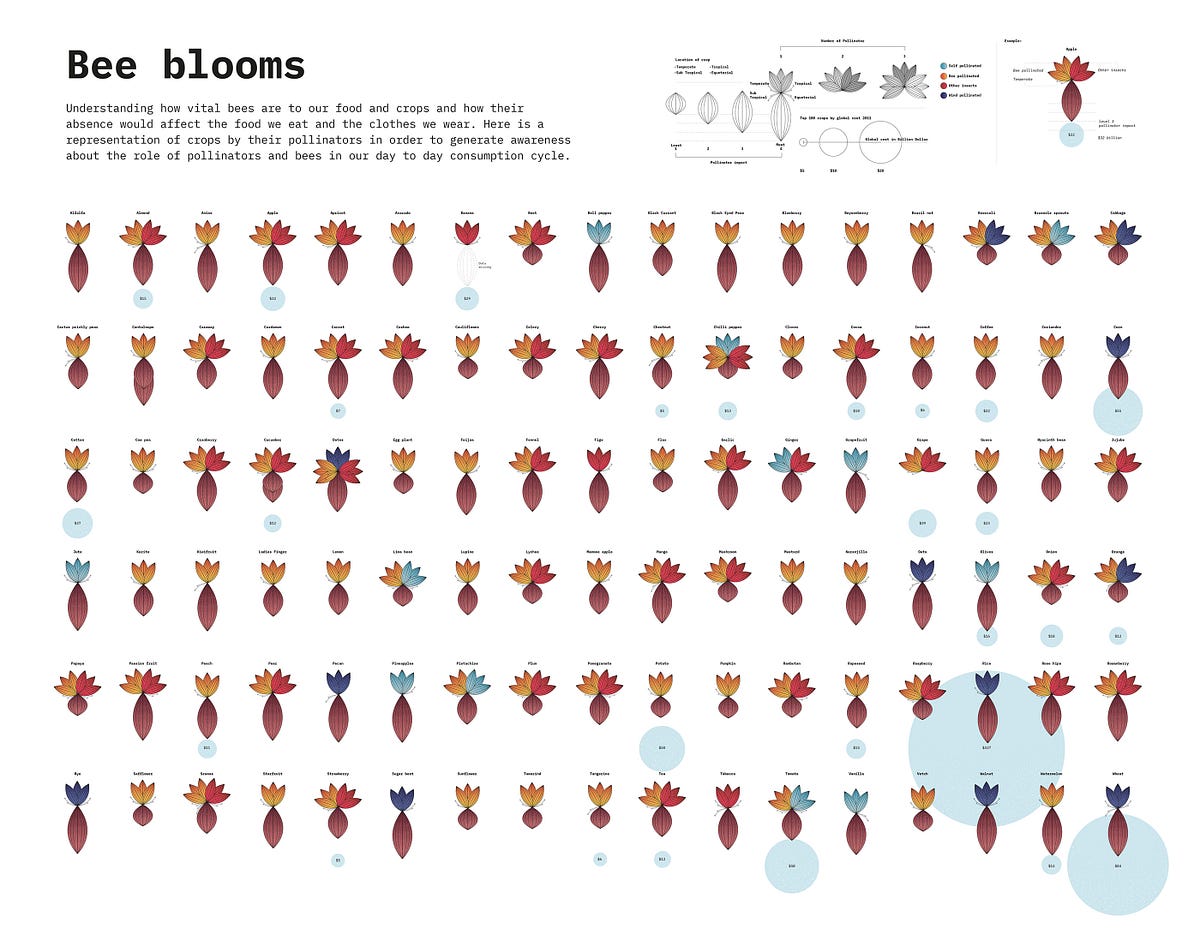
Data visualisation is a defining part of my curriculum for my masters degree in Information Design at National Institute of Design, Bangalore. I’ve had 365 days over the course 2 semesters to practice the subtle art of data visualisation.
I learnt a few tips and tricks and made a lot of mistakes on the way. This article will cover those mistakes. Knowing what not to do can be pivotal in helping one find direction and keep on track and can save a lot of time and misery.
The examples I quote here in are from projects I’ve worked on and you can find links to them at the end of the article.
#data-visualisation #data-visualization #data-visualization-tools #information-design #data

1.30 GEEK