Let me start the article by asking a question. Suppose, there’s a group of 23 people. What is the probability of at least two people sharing the same birthday in the group(only day and month, not year)? Most of us think it is a very less chance of at least two people sharing the same birthday in a group because there are 365 days in a year and only 23 people are in the group. But what if I (Sorry not me, math) tell you, the likelihood of two of 23 people sharing the same birthday is around 50%.
In simple words, suppose there are 100 groups, each group has 23 randomly selected people. Then out of these 100 groups, around 50 groups have at least 2 people sharing the same birthday. And the twist is that if there are 60 people in a given setting, then this probability increases to 99%. It seems unrealistic because the probability of sharing the same birthday with one of any 22 people who enter our lives in a given instance should be utterly low in a system where there are 365 days, but still, it is considerably high, around 50%. This is** the birthday problem**. I will explain this problem with the math, but the best and easiest way to convince yourself that it is true, by simulating the experiment.
The Simulation
Simulation is programming the computer or a model to act as if the real thing was happening. Simulation is very easy than doing the actual thing. I have simulated the birthday problem in a python language. I created a function named prob_of_same_birthday. It takes group size as an argument. Let’s say it is N. So, to those N people, I assigned random birthdays and checked whether there exists a pair of two people sharing the same birthday. I did the same thing 10,000 times (why that many high times, I will explain in later part of this article). So, that function returns the total number of groups in which at least 2 people are sharing the same birthday. By divide this number with 10,000, I found the probability of at least two people sharing the same birthday in a group of N people.
def prob_of_same_birthday(groupSize):

	  ## No of trials (no of groups)
	  trials = 10000

	  ## count is number of groups in that at least two people are sharing same
	  ## birthday
	  count = 0

	  for trial in range(0,trials):

	    ## This list has 366 zeros as we haven't assign birthdate to any one yet.
	    days = [0]*366

	    for _ in range(1, groupSize+1):

	      ## This is the birthday of a chosen person (randomly assigned)
	      birthDay = random.randint(1,365)

	      ## days[birthDay] is 1, if someone has already birthday on that day
	      if(days[birthDay]):
	        count += 1      ## increase count

	        ## Because now we know that there is at least a pair of person that
	        ## shares same birthday.So, no need to check further
	        break
	      else:
	        ## days[birthDay] is assign 1 beacuse chosen person has birthDay on this
	        ## day
	        days[birthDay] = 1

	  return (count/trials)*100  ## probability
view raw
prob_of_same_birthday hosted with ❤ by GitHub
Now, I did the same thing for a group size of 1 to 365. Because if group size is greater than 365, then the probability of at least two people sharing the same birthday in the group, is 100% because there are 365 days in a year.
## list of group sizes from 1 to 365\. For group Size > 365, prob. is always 100%
	X = [groupSize for groupSize in range(1,366)]
	## list will assigned a probability
	Y = []

	for groupSize in X:
	  Y.append(prob_of_same_birthday(groupSize))
view raw
function_call hosted with ❤ by GitHub
Result
Then I plotted two variables from the above code:- X and Y. And this was the result of our simulation.
## Find at least how many people need in a group to have probability greater than 50%
	count = None
	for groupSize in X:
	  if(Y[groupSize-1]>=50):
	    count = groupSize
	    break

	## Plotting a Graph for visulization
	figure(figsize=(20,9))
	x_axis = [groupSize for groupSize in range(0,81,5)]
	x_axis.append(count)
	plt.xticks(x_axis,fontsize = 12)
	plt.axvline(count,linewidth=2,color="black")
	plt.axhline(50,linewidth=2,color="black")
	plt.yticks([p for p in range(0,101,5)])
	plt.plot(X[:80],Y[:80],linewidth = 2.5)
	plt.xlabel("Group Size",fontsize = 15)
	plt.ylabel("Probability",fontsize = 15)
	plt.grid()
	plt.savefig("main_graph.jpg")
view raw
main_graph hosted with ❤ by GitHub
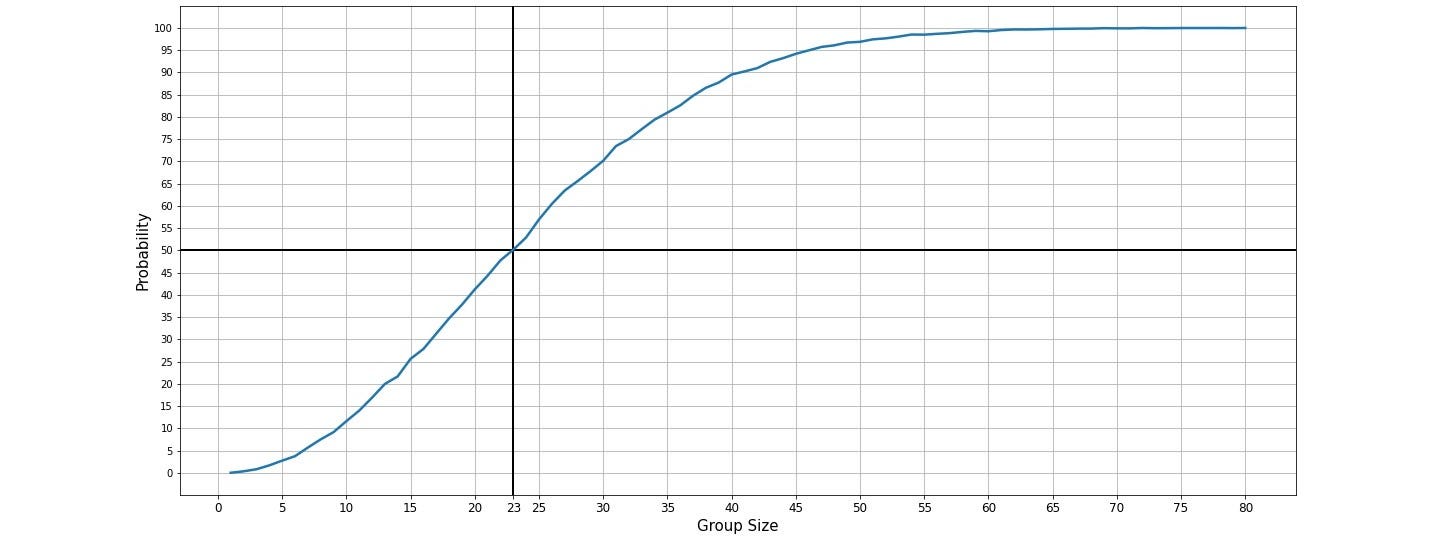
Here, X-axis shows group size and Y-axis shows probability. And here we can see for a group of 23 people, the probability is a little higher than 50% and for group size 60, it is around 99%. So, from this simulation, we can say that the birthday problem really exists.
The Law of large numbers
Now, let’s discuss, why I chose 10,000 trials (or groups) for each group size. This is because of “The law of large numbers”. According to the law, the average of the results obtained from a large number of trials should be close to the excepted value and will tend to become closer as more trials are performed.
#mathematics #simulation #probability #data-analysis #data analysis