TiDB is an open-source, distributed SQL database that supports Hybrid Transactional/Analytical Processing (HTAP) workloads. Ideally, a TiDB cluster should always be efficient and problem-free. It should be stable, load-balanced, and have a reliable rate of queries per second (QPS). There shouldn’t be any jitters (either in the cluster or on disk), and no hotspots, slow queries, or network fluctuations.
However, reality is often unsatisfactory. For external reasons, application traffic may surge and increase the pressure on the cluster. Through a chain reaction of events, the CPU load maxes out, out of memory errors occur, network latency increases, and disk writes and reads slow down.
Before TiDB 4.0, when these problems occurred in the cluster, there was no uniform way to locate them. We had to use various external tools to find problems in the cluster. It was tedious and time-consuming.
Now, TiDB 4.0 introduces a new feature, cluster diagnostics, a built-in widget in TiDB Dashboard, which lets you diagnose cluster problems within a specified time range and summarize the diagnostic results and cluster-related load monitoring information in a diagnostic report.
Our previous post gave you a quick peek at this feature. In this post, we’ll elaborate on cluster diagnostics’ diagnostic reports, and show you examples of how cluster diagnostics can help you quickly find system problems.
 Cluster diagnostic report
How Cluster Diagnostics Makes Your Job Easier
It’s important to provide a consistent user experience and reduce the learning curve. There is a lot of information that is relevant to troubleshooting, including cluster static information and cluster runtime information. We reorganize this information across the entire cluster to make sure that you can access it using SQL queries, without the need for external tools. At the same time, you can extract common SQL statements as scripts and write different troubleshooting scripts for different application scenarios.
Querying Logs With Cluster Diagnostics
In a TiDB cluster, a single transaction might involve multiple instances of TiDB’s storage engine, TiKV. Before TiDB 4.0, if you wanted to view logs related to a specific transaction ID ( txn_id), you might need to log in to all nodes and view the logs using the grep command. But in TiDB 4.0 and later, we offer cluster log tables. You can view all relevant logs with only one SQL statement. For example:
Plain Text
1
SELECT * FROM information_schema.cluster_log where message like "%{txn_id}%" and time > '2020-03-27 15:39:00' and time < '2020-03-27 15:50:00'
Similarly, splitting and merging the basic unit of TiKV storage (the Region) and the Region leader switch usually involve multiple TiKV nodes. You can quickly view all activities in a life cycle of a Region through the log table.
When you query logs, the SQL statement’s predicates are pushed down to each log node for filtering, and no program collects all the logs. So the overhead is controllable and is lower than using the grep command. You can do what a distributed grep command can do but with less overhead.
Cluster Diagnostic Reports
In TiDB 4.0, if you want to diagnose or inspect the cluster within a time range, or check the load of the cluster, you can generate a diagnostic report for some time in TiDB Dashboard. The diagnostic report contains the diagnostic results during this period and monitoring and configuration information for each component in the system.
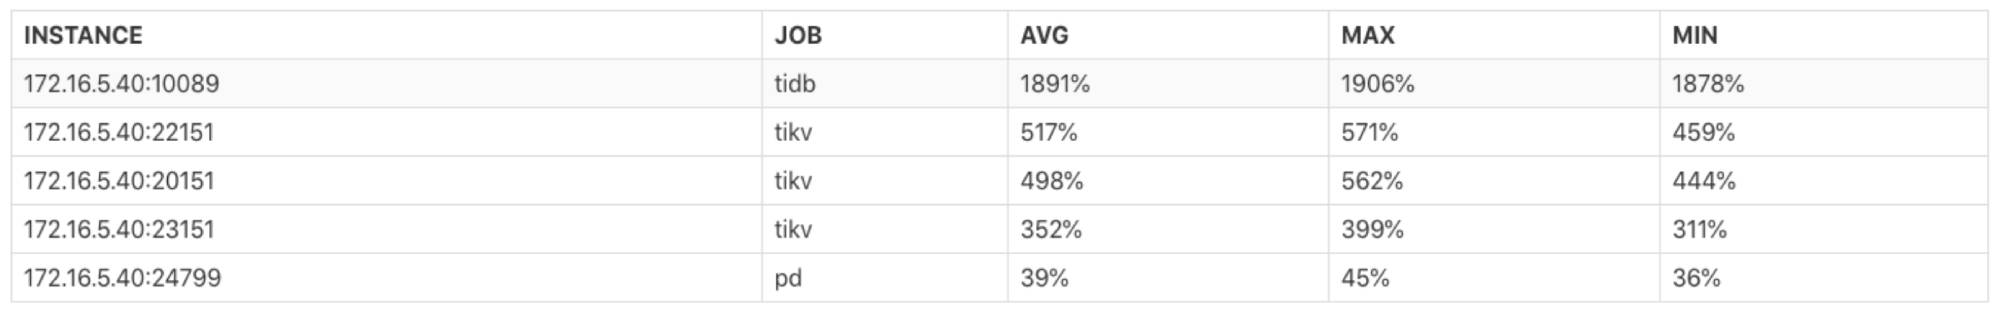
The Instance CPU Usage Report
The instance CPU usage report lets you view the average (AVG), maximum (MAX), and minimum (MIN) CPU usage for TiDB, Placement Driver (PD), and TiKV instances. You can use this report to quickly judge whether the cluster’s load is balanced or if it has hotspots.
 The instance CPU usage report
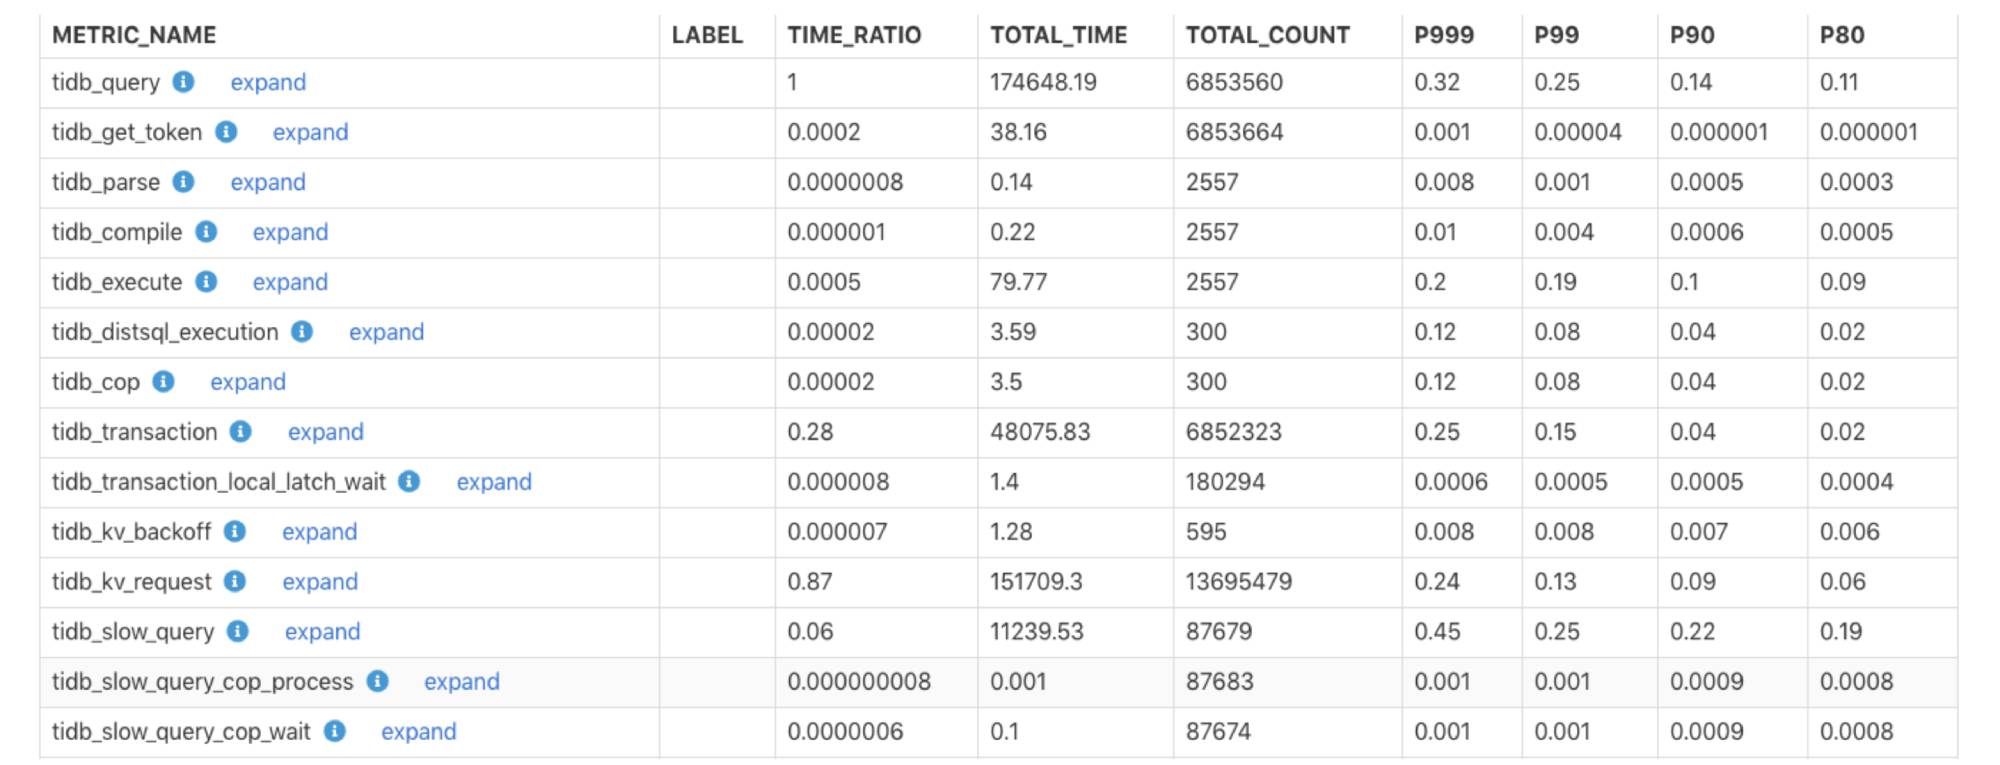
The Monitoring Execution Time Report
The monitoring execution time report presents the monitoring time for each component in the cluster and what percentage it is of the total execution time for all queries. You can use this report to quickly determine whether a component’s execution time is too long and whether there is a bottleneck.
#performance #sql #troubleshooting #database administration #distributed system #tidb