What is Time-Series Analysis?
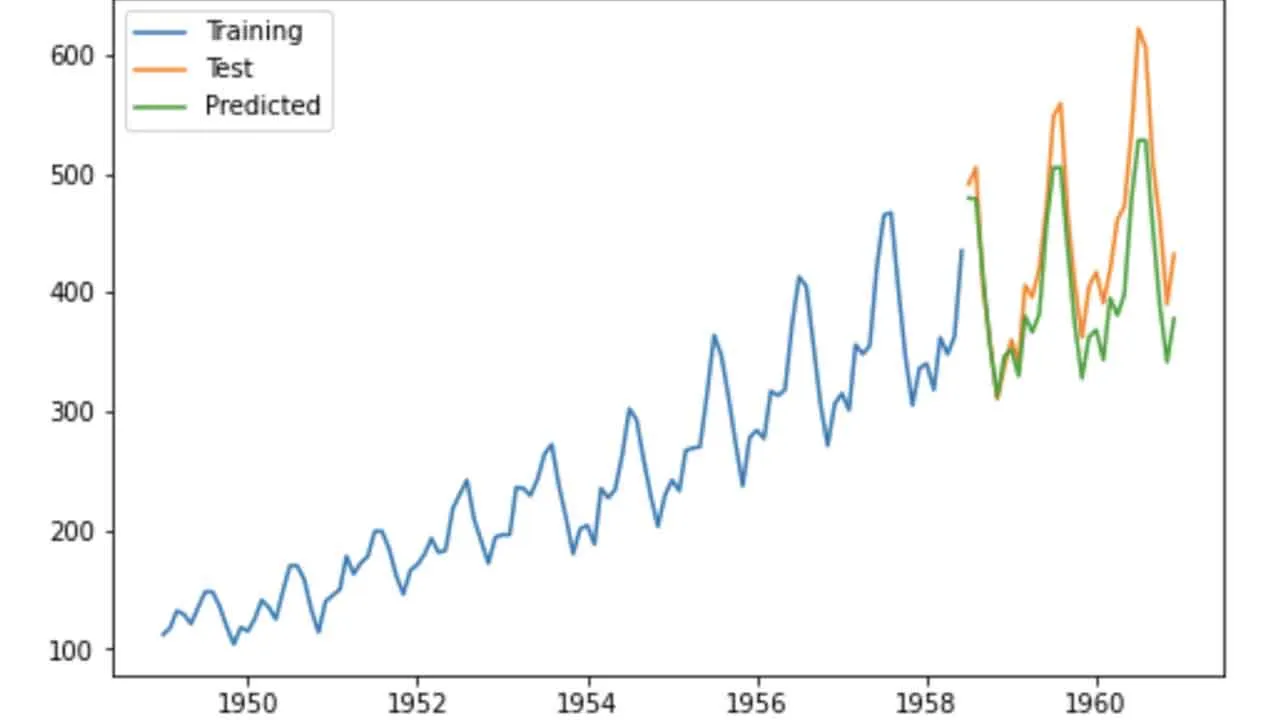
One of the key concepts in data science is time-series analysis which involves the process of using a statistical model to predict future values of a time series (i.e. financial prices, weather, COVID-19 positive cases/deaths) based on past results. Some components that might be seen in a time-series analysis are:
- Trend : Shows a general direction of time series data over a period of time — trends can be increasing (upward), decreasing (downward), or horizontal (stationary).
- Seasonality : This component exhibits a trend that repeats with respect to timing, magnitude, and direction — such as the increase in ice cream sales during the summer months or increase in subway riders during colder months.
- Cyclical Component : A trend that has no set repetition over a certain time period. A cycle can be a period of ups and downs, mostly seen in business cycles — cycles do not exhibit a seasonality trend.
- Irregular Variation : Fluctuations in time-series data that is erratic, unpredictable and may/may not be random.
When conducting time-series analysis, there are either Univariate Time-Series analysis or Multivariate Time-Series analysis. Univariate is utilized when only one variable is being observed against time, whereas Multivariate is utilized if there are two or more variables being observed against time.
#machine-learning #data-science #python

2.15 GEEK