This project monitors availability and tracks SLA/SLO targets through built-in dashboards and Prometheus metrics. Check out this Science Fair submission!
When applications go in production one of our main concerns is to ensure that they are properly monitored, notably with appropriate checks and suitable metrics to report about their availability over time. This article comes to cope with this concern. Particularly focused on applications running on Kubernetes, it sets up a standard to monitor, measure, and observe the availability of applications. The goal being to help organizations to define Service Level Objectives (SLO) and/or Service Level Agreements (SLA) while be able to track them through factual KPIs.
This article is structured around two main sections. This first one is conceptual, introducing our fundamentals and assumptions to define, monitor, and measure application availability on Kubernetes. The second section is practical, demonstrating an implementation powered by RealOpInsight — our open source implementation of the introduced concepts. In a nutshell, RealOpInsight is application operations monitoring framework designed to work atop of Kubernetes by leveraging its basic probe capabilities against pods and containers.
Side note on the Project: This works raised from a spare time project started a few years ago with the intend to fill in lacks of efficient operations monitoring capabilities identified from traditional open source IT monitoring tools such as Nagios and Zabbix. Since then, the paradigm of IT monitoring has evolved significantly, notably due to the emerging of micro-service architectures. Therefore, the project efforts have been refocused on applications running on this new ecosystem. RealOpInsight code base has been almost completely rewritten and the deployment rethought to be fully cloud-native ready. That said, nothing is perfect, so everything improvement feedback is welcomed.
The Challenge
Given one or more instances of Kubernetes, our goal is to be able to monitor, measure, and track the availability of applications as established by the following tenets:
- Defining a Kubernetes application: we define an application in one of these two ways. On the one hand, a simple application can be modeled as a set of Kubernetes services along with their pods within a single namespace. In this case the application can be viewed as a dependency tree-like on the Diagram 1.a (below). Concretely, the dependency tree is a hierarchical composition of services along with the pods and containers that underlie them. Each container is associated to its pod, which in turn associated to its service, which finally is associated to the application at the top level. On the other hand, a complex application can be modeled as a composition of two or more namespace-scoped applications.
- Computing application status: Behind the scene the status of an application is computed by gathering the state of the underlying pods (along with their containers), then aggregate and propagate these low-level status throughout the dependency tree. By essence, probes at the pods and containers levels are achieved by Kubernetes. The status aggregation along the tree takes into account the type of resource controller that manages the different backing pods. Typically, pods in a ReplicatSet assume the same functionality (i.e. same importance) while it’s not always the case for pods in a StatefulSet. On the Diagram 1.a for example, we highlight a situation where a pod in a ReplicatSet is in error, but the service is just labeled with a warning state. The aim of such an advanced status aggregation is to help operations teams to trigger incident resolutions with appropriate priority.
- Defining application availability: At each time, the overall current status of an application is determined by status at the top level of the application dependency tree. This status gives quick insight on how the application is operating (e.g. green for healthy, red if critical problem, orange for non-critical problem). An application is meant available if its overall status is not critical.
- Observe application availability. At the top level of this approach (Diagram 1.b) we have at each time the healthiness status of each application. _Our standard design assumes that the status of each application is computed every five minutes (arbitrary periodicity) and logged for future availability analytics. _Not only the status of application is important to be logged, but also a summary of probes status (i.e. ratio of containers in failure and normal states).
- Defining SLA/SLO targets: On the basis of the above considerations, SLO/SLO targets for an application can be defined based on its availability for a given period of time set by a start and an end date. For example, considering a period of 7 days with five-minutes application availability checks (i.e. 1440 checks total), if the application was not available during 2 checks, then the availability during that period can be computed as follows :
(1440 — 2)/1444 = 99.9986%. With this foundation, we open room to easily to track the operations of Kubernetes applications over time.
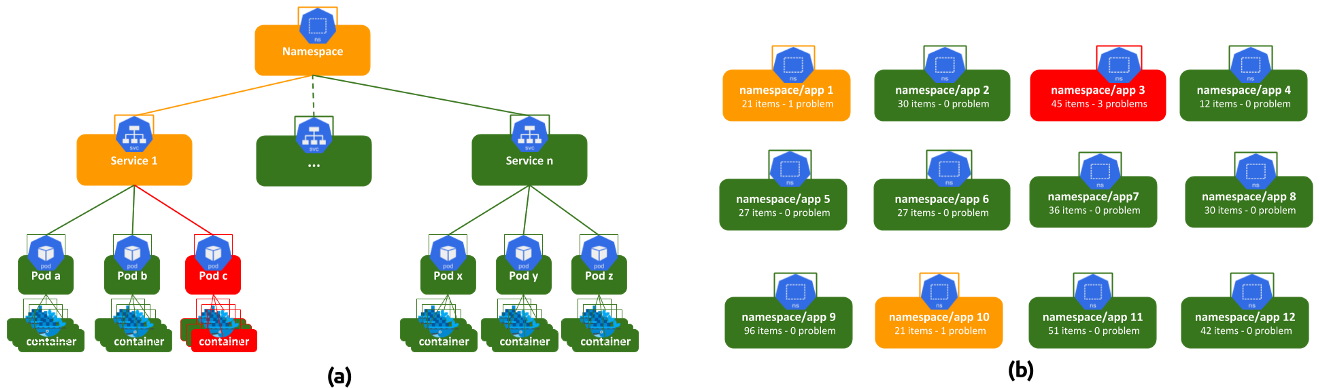
Diagram 1: Conceptual view of Kubernetes applications availability monitoring _(a) _ Sample of a namespace-scoped application dependency tree per _(b) _ Sample of high-level dashboard showing the current consolidated status of a set of applications.
Keeping the above tenets in mind, still with the objective to be able to define and track SLA/SLOs targets for Kubernetes applications, the second part of this article aims at demonstrating how that works. Thanks to an implementation, namely RealOpInsight, w e’ll present the architecture building blocks, demonstrate a quick deployment on a Kubernetes cluster. The deployment will be followed by a quick demo. We’ll demonstrate built-in dashboards and show how it’s possible to extend those dashboards using 3-party data visualization tools. This extended visualization can be online leveraging the RealOpInsight’s built-in Prometheus exporter (e.g. with Grafana), or offline by leveraging its capabilities to export data in CSV.
#kubernetes #monitoring #microservice architecture #grafana #prometheus
