We live in the era of data. More and more businesses realize the potential to create value out of data. The advancements in technology offer highly efficient tools to both collect and analyze data which further motivated businesses to invest in data science and analysis. Thus, we see job listings like data analyst, data scientist, machine learning engineers on various platforms more than ever.
I recently came across a dataset of data analyst job listings on kaggle which contains details of 2253 jobs from glassdoor website. I wanted to explore this dataset to gain insight on the details of jobs. It will also be a good practice of using data analysis tools.
The skills we will practice throughout the post:
- Data cleaning and analysis with pandas
- Basic natural language processing (NLP) techniques with NLTK
- Data visualization with matplotlib and seaborn
Let’s start with importing the libraries.
#Data analysis
import numpy as np
import pandas as pd

#NLP
import nltk
nltk.download("popular")
#Data visualization
import matplotlib.pyplot as plt
import seaborn as sns
sns.set_style('darkgrid')
%matplotlib inline
We can now read the data into a pandas dataframe.
df = pd.read_csv("/content/DataAnalyst.csv")
print(df.shape)
df.columns
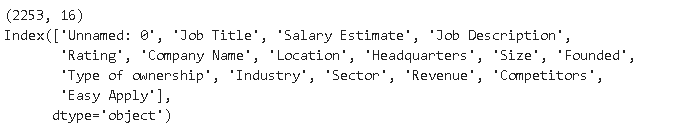
There are 2253 job listings with various details on the job and company.
Job Description
Job Description column contains a long text describing the job details and what skills are expected from the applicants. In order to obtain a general overview, we can read all the job descriptions which is definitely not a data-analysis-oritented way. The other, and much more preferable way, is to apply natural language processing (NLP) techniques to infer some insights. I will use tools offered by **NLTK **library but there are many text preprocessing libraries that have the same tools.
One way is to count the occurrence of each word to check for the most common words. We first convert the “job description” column into a long text file and then tokenize it. Tokenization simply means splitting a text into smaller units such as words.
from nltk.tokenize import word_tokenize
text = ''.join(df['Job Description'])
words = word_tokenize(text)
We used the word_tokenize module of NLTK. There are some things we need to fix before going further. The first one is to lower all the letters. Otherwise, “Data” and “data” will be processed as different words. Words like “a”, “the”, “we” are not useful for our analysis so we need to remove them from the tokenized list. Finally, punctuations need to removed so that they are not counted as words.
#lowercase letters
words = [word.lower() for word in words]

#Remove punctuation and stopwords
punc = [',','.',';','-','"','!','--','?', '."',"'",':',')','(',"'s"]
from nltk.corpus import stopwords
stop_words = stopwords.words('english')
words_filtered = [word for word in words if word not in (stop_words + punc)]
We used list comprehensions to filter the initial tokenized list. FreqDist function of NLTK provides a frequency distribution that shows the number of occurrences of each word.
#data-analysis #data-science #programming #machine-learning #artificial-intelligence #data analysis