In this Power BI tutorial, learn how to perform recursive calculations with Python! This method will allow you to iterate over a table and perform a function that calculates the results based on the previous row’s calculation.
Have you ever tried to write a recursive calculation using DAX? Don’t! I’ve spent many hours trying to accomplish this feat. I never say that anything is “impossible” in Power BI, but for recursive DAX calculations, I believe that’s accurate.
That’s where Python comes in. Python makes it extremely easy to write recursive calculations that iterate over rows of the dataset to build compounding calculations. In this post, I’m going to demonstrate two example calculations that need to be performed recursively. The first example will be the standard Fibonacci sequence and the second example will be an example that will look more like what you might expect in a business setting.
Before we dive into the trick, you will need to have Python and the necessary packages installed on your machine and have Power BI set up to recognize the Python installation. If you need help getting started, see my previous video: https://www.youtube.com/watch?v=EmALxO7V7y0
Fibonacci Sequence
The Fibonacci sequence is a basic calculation where the current row is equal to the sum of the previous two rows. This is easy to perform in Excel, as shown in the following picture.

In the above picture, the calculation in row 8 is simply the sum of rows 6 and 7. But if you think hard about what is actually happening, row 7 is the sum of rows 5 and 6, and row 6 is the sum of rows 4 and 5. You can quickly see that in order to calculate the value in row 8, we need to firstly perform the calculation for each row prior. This is basic recursion and it is necessary in a bunch of calculations, especially those performed in Excel.
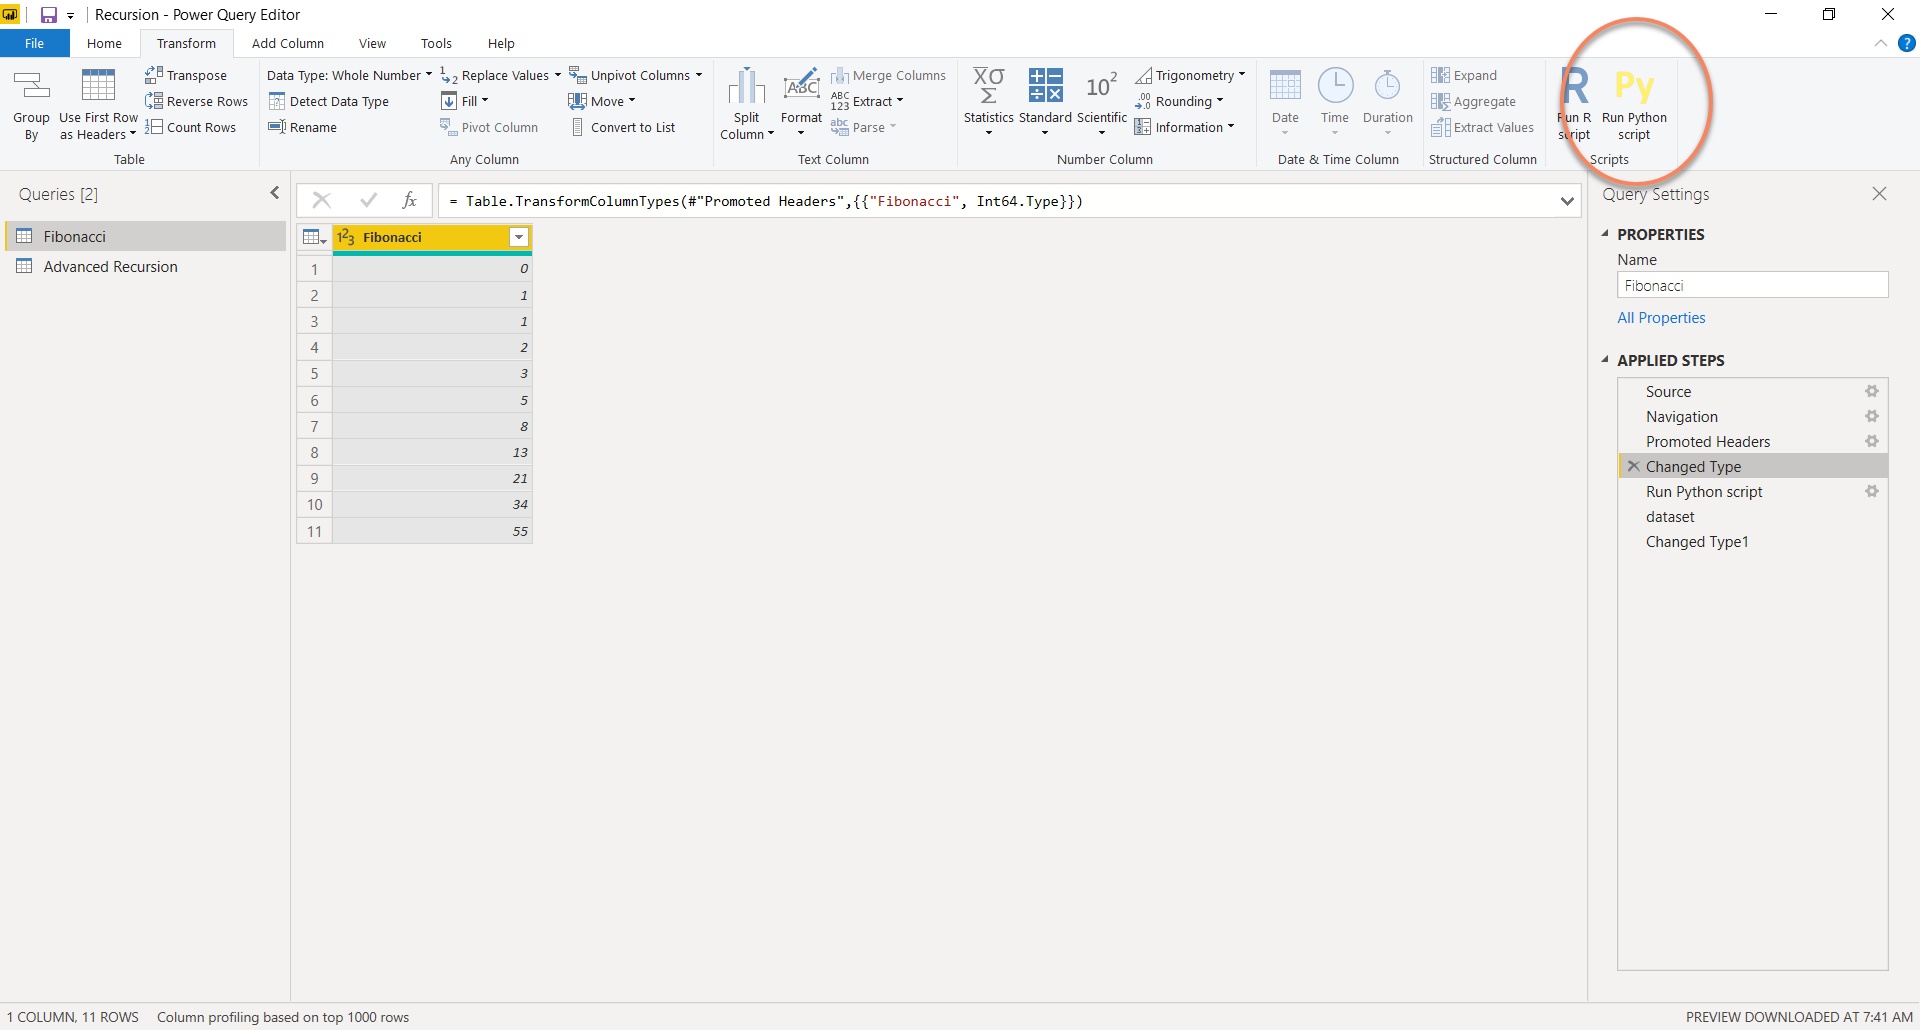
I’ve gone and connected to my Excel file within Power BI to give myself a table to run the Python script on. Then, click on the “Run Python Script” button in the top-right of the Transform tab.

When the Python editor pops up, I simply add the following code:
dataset.loc[0,'Fibonacci Python'] = 0
dataset.loc[1,'Fibonacci Python'] = 1
for i in range(2, len(dataset)):
    dataset.loc[i,'Fibonacci Python'] = dataset.loc[i-1,'Fibonacci Python'] + dataset.loc[i-2,'Fibonacci Python']
There are a couple main points to understand what is truly going on here. First, the existing table is passed into the Python script as a Pandas DataFrame named “dataset.” You can see that I reference dataset many times during the script. In the first line, I am using dataset.loc to set the value at the 0th index (1st row) to 0. Since I don’t already have a column titled Fibonacci Python, a new column is created. The next line is very similar where I am setting the second row in the Fibonacci Python column equal to 1. It’s necessary to set these constants when calculating the Fibonacci Sequence.
The next step is where the real magic happens. I create a for loop from the 3rd row until the last row of the table and set the current value equal to the previous value plus the previous previous value. You can see that we are referencing “i” in the code which refers to the current row of the iteration. We also reference i-1 and i-2 which refers to the previous calculation and the calculation 2 rows prior. With that, we are effectively iterating through the rows of our table and applying a recursive calculation!
Our output looks exactly like our Excel column so we know we are correct!

Advanced Business Calculation
Next, let’s apply similar logic to perform a more complex calculation. This calculation will firstly square the value of the first row. For all remaining rows, we take the previous calculation and add it to the current row squared. See below for an example:

The setup of the code is basically the same, with just a couple differences.
dataset.loc[0,'Advanced Calc Python'] = dataset.loc[0,'Performance'] ** 2
for i in range(1, len(dataset)):
   dataset.loc[i,'Advanced Calc Python'] = dataset.loc[i-1,'Advanced Calc Python'] + dataset.loc[i,'Performance'] ** 2
First, we set the first row at index 0 equal to the first row of the Performance column to the power of 2. Our value will be stored in a new column called “Advanced Calc Python.” Then we create a similar for loop, starting from 1 and ending at the bottom of our table. We set the current calculation equal to the previous calculation + our current Performance value squared. This will continue to calculate recursively until the end of the table is reached.
When we take a look at the output, we see that our Python column matched our Excel column perfectly!

Recursive calculations that iterate over a table in Power BI are so powerful that you’ll definitely want to keep this trick in your toolbox 😊
Also, if you’re looking for top Power BI training for a fraction of the price, make sure to check out the BI Elite Training portal! There is a ton of great info available that you’re sure to enjoy.
Originally published by Parker Stevens at bielite.com
#python #power bi
