“The greatest value of a picture is obtained when it forces us to notice what you never expected to see.” — John Tukey
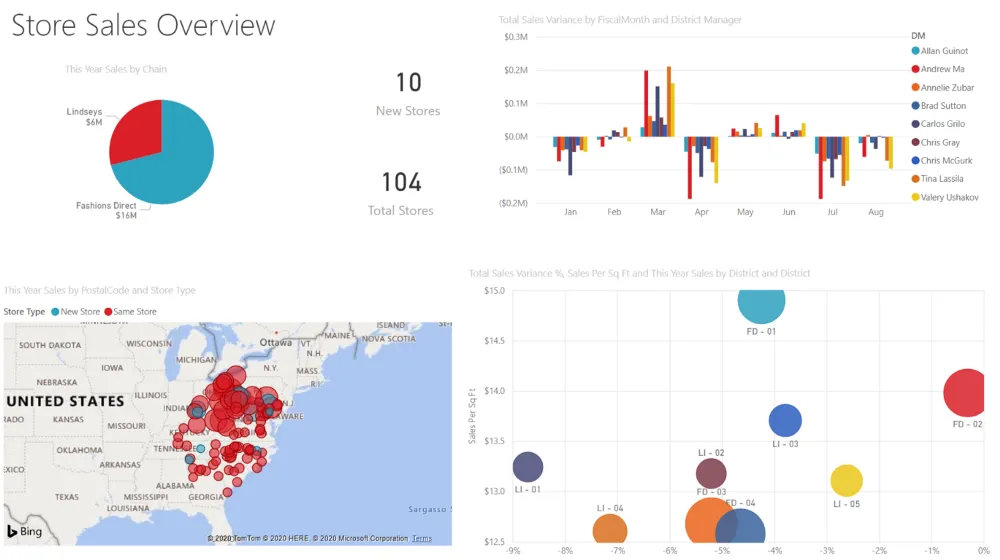
Data visualization is the graphical representation of information and data. By using visual elements like charts, graphs, and maps, data visualization tools provide an accessible way to** interpret and understand trends, outliers, and patterns in data**. In a context of Big Data and massive volumes of information to process, data visualization softwares come to hand and become an essential tool to allow data analysts to gain insights about the data they’re processing in a simpler and much faster way.
Other tools at disposal to achieve the same goal include programming skills, which allow us to build more flexible and customized features but at the cost of spending more time on such personalized visualizations. In case you’re interested in getting involved in the data visualizations with programming skills, take a look at an article I wrote about the subject:
In this article, I include an extensive guide on how to utilize Power BI, a business analytics service provided by Microsoft, to prepare our data visualization analysis. Please join me in this practical explanation!
Table of contents:
1. Introduction to Power BI. (2 min read)
2. Why should you use it? (2 min read)
3. Plot types (5 min read)
1. Introduction
Power BI is a business analytics service by Microsoft. It aims to provide interactive visualizations and business intelligence capabilities with an interface simple enough for end users to create their own reports and dashboards.
In essence, it consists of a collection of software services, apps, and connectors that work together to turn unrelated sources of data into coherent and interactive insights. Data may be stored in an Excel spreadsheet, in a cloud-based environment or data warehouses and still be accessible from Power BI to be analyzed easily.
**Power BI **consists of a set of applications that work together to let you create and consume business insights. The three most utilized are:
- A Windows desktop application called Power BI Desktop.
- An online software service service called the Power BI service.
- Power BI mobile apps for Windows, iOS, and Android devices.
#data-visualization #business #business-intelligence #data-analysis #data-science
