Hello folks, If you are doing Data Analytics and Data visualization then you might have come across Microsoft Power BI, a cloud-based tool that is quickly getting very popular among Business Analysts and other technical people who work with Data.
Power BI is a tool offered by Microsoft corporation to create various types of visualization using your data and produce stunning reports and dashboards so you will get insights into your business and make the right decision.
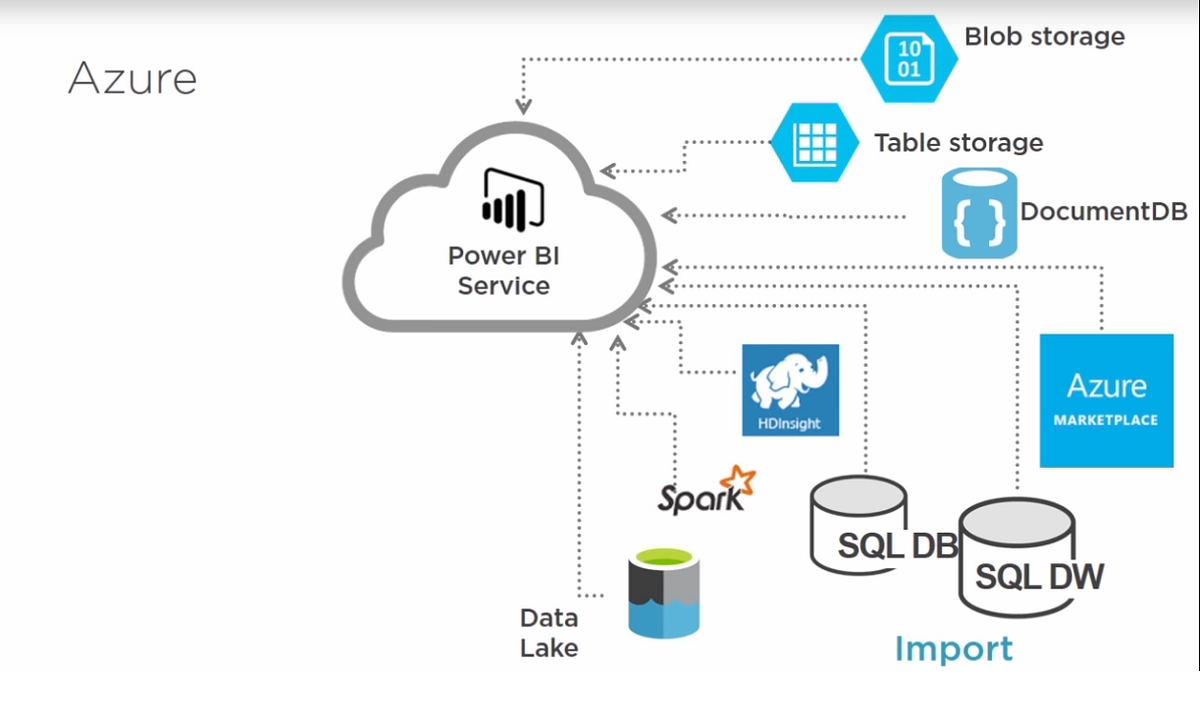
You can use Power BI on your desktop or using the Power BI on the cloud or even on your mobile as an app it’s up to you how you will use it.
As a data visualization engineer having the skills to run Power BI is more than a good thing because it enables you to create very sophisticated visualization in a small tie with just pressing some buttons and this skill is very in demand in almost every company because you helping them to make the right decision and grow their businesses.
In this article, I’ll share the best online courses that will help you master this application and boost your knowledge and career in data visualization.
10 Best Courses to learn Microsoft Power BI in 2020
Without wasting any more of your time, here is a list of best online training courses to learn Microsoft Power BI for Data Analysis, Data Analytics, and Data Visualization this year. These are the best online courses, created by experts and useful for both beginners and experienced programmers.
1. Microsoft Power BI — A Complete Introduction
You will learn in this course all the Power BI editions such as the desktop, the cloud, the mobile, and the premium version of Power BI. You will start from zero until you get experience and be familiar with this application and create your own project.
Starting with the Power BI desktop which is the easiest one then moving to the cloud version where you will discover more advanced techniques and learn how to create your own visuals by programming than learning how to use this application on mobile.
You will learn in this course:
- Using various editions of Power BI.
- Mak your own visuals.
- Access your dashboard using mobile.
This course is created by Maximillian Schwarzmuller of AcadMind, one of my favorite instructors on Udemy and author of several best selling Udemy courses on web development.
**Here is the link to join this course — **[Microsoft Power BI — A Complete Introduction]
2. Power BI A-Z: Hands-On Power BI Training For Data Science!
The most data scientist uses programming languages such as Python or R to do their visualization and get insights from their data but actually, they can use this tool power bi to do it and this is what this course is all about.
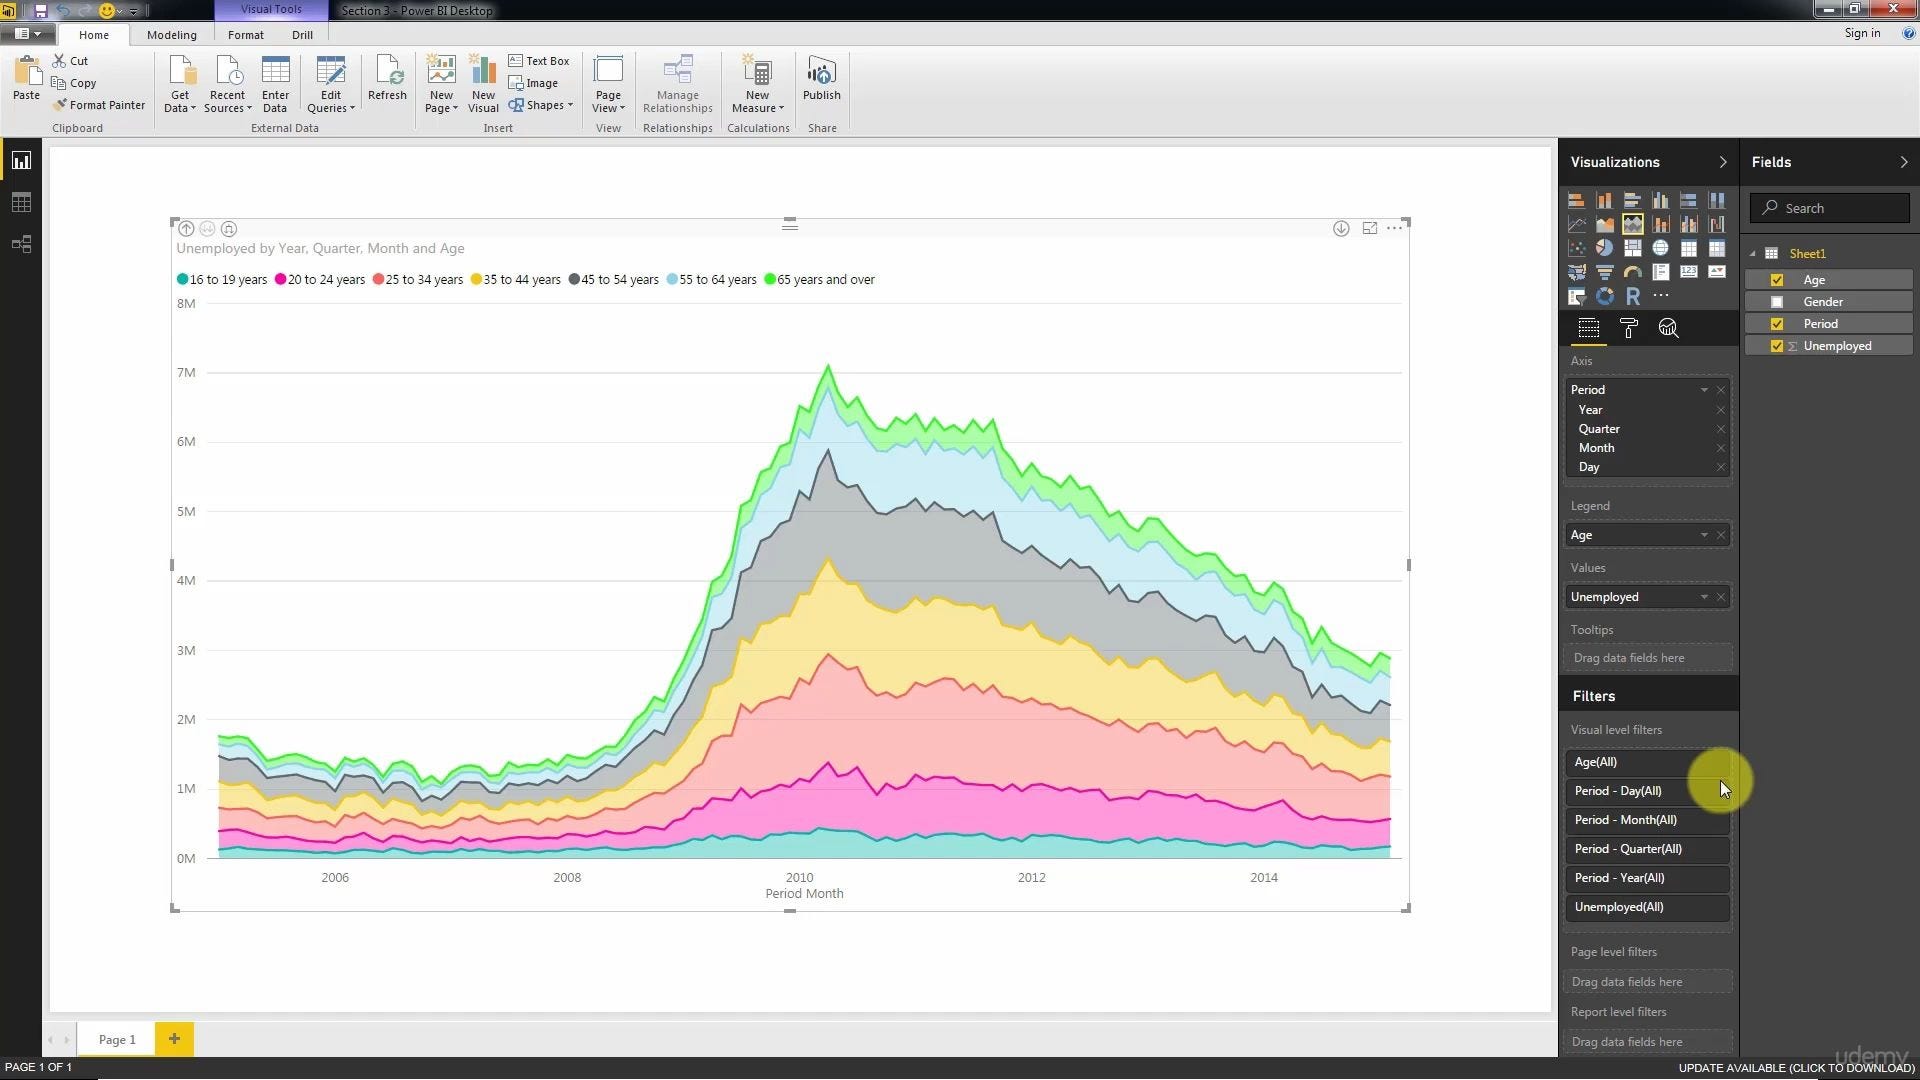
You will see how to use Power BI to create different types of charts, graphs, and nice plots that you can use it for data mining or powerful business intelligence reports and by using real data from real-world businesses.
You will learn in this course:
- How to use Power BI.
- Create various types of visualizations.
- Create business intelligence reports.
This course is created by Kirill Eremenko and his SuperDataScience team which has created many wonderful courses on Data Science, Machine Learning, and Artificial Intelligence on Udemy.
**Here is the link to join this course — **Power BI A-Z: Hands-On Power BI Training For Data Science!
3. Getting Started with Power BI — Pluralsight
This course is aimed to be for a beginner who wants to master this valuable tool and enhance their data analysis and produce more powerful reports to get more insight from your data for better business decisions.
You will learn in this course:
- How to create a visualization.
- How to use Excel 2016.
- Enhance your data visualization.
Starting by how you can collect your data and clean it then moving to how to use that data inside Power BI and create visualization and how you can enhance your results and more you will discover on this course.
#data-visualization #data-science #power-bi #course #data-analysis #data analysis